- More declines likely on Mercury-Mars-Saturn pattern
- Dollar may finally break above 78
- Gold will continue to weaken
- Crude risks falling to $60
- More declines likely on Mercury-Mars-Saturn pattern
- Dollar may finally break above 78
- Gold will continue to weaken
- Crude risks falling to $60
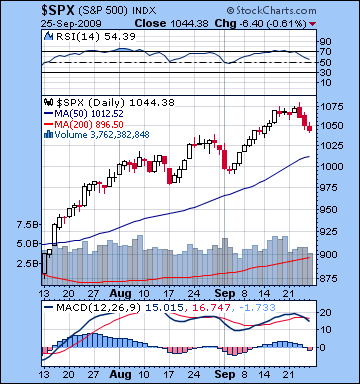 Stocks in New York fell 2% last week as investors contemplated the possibility that the recovery might be weaker than anticipated. After making new yearly highs intraday on Wednesday (9900/1080), the market reversed and headed down for the rest of the week. The Dow closed at 9665 and the S&P finished at 1044. Although the early week strength was surprising given the Mercury-Saturn conjunction, the down movement generally conformed with our forecast. I had expected more downward pressure on the Mercury-Saturn conjunction but this alignment may have had a positive influence since the market fell before (Monday) and after (Wednesday) the aspect came exact. Also, the bounce I had predicted for Wednesday on the Mars-Jupiter aspect appears to have manifested slightly early as markets rose Tuesday and into Wednesday afternoon. The largest declines occurred Thursday and Friday despite a positive aspect from the Sun and Jupiter. This was an instance of missing the forest for the trees as the favourable Jupiter energy was apparently overwhelmed by the active Mercury-Saturn-Rahu complex. When planetary alignments are as geometrically dense as these (i.e. planets clustering around similar degrees of respective signs), it is more difficult to distinguish their corresponding times of manifestation. And yet even with last week’s confusing intraweek dynamics, we can take some solace in the fact that the market is still on course to correct in the aftermath of the Saturn-Uranus opposition. Wednesday’s high may be interpreted as significant contrary evidence to our correction thesis, but the failure of the market to close above the previous week’s level is noteworthy. And with the late week pessimism, we can make a better argument that the period of retracement is now underway.
Assuming we do continue to move lower here, the market rise to 1080/9900 on Wednesday might be seen as a false breakout from the bearish rising wedge pattern. Both the Dow and S&P remain firmly ensconced between the upper and lower limits of the rising wedge. Depending on how one draws it, the market is still about 1-2% above the support line (1030/9400). Some analysts have also mentioned 1040 as a critical line of defense for the bulls and Friday’s trading saw the SPX successfully test that support. Certainly, any closes below 1040 may be seen as significant break out, although given the size and length of the current rally, it may take a breach of 1030 for selling to accelerate. RSI (54) looks quite bearish now, as it has turned down sharply after staying near 70 for several weeks. MACD has also turned down and features a bearish crossover, another indication that the rally could well be over for now. Volume fell last week, although this is perhaps less important given the negative outcome. And even with last week’s three straight down days, the Bullish Percentage Index ($BPSPX) still stands at a lofty 86 after reaching a midweek high of 88. According to this sentiment indicator, readings above 70 are considered overbought and above 80 are very overbought. This is another sign that the market still has a long way to go before it fully corrects.
This week holds the prospect of further declines, perhaps even larger ones that we saw last week. Mercury ends its retrograde cycle before the Tuesday’s open. While its retrograde period has not lived up to its bearish billing, Mercury’s direct station here is made much more problematic due to the very close Mars sextile (60 degree) aspect and of course, the continued proximity of pessimistic Saturn just 4 degrees away. Readers may recall that a previous Mercury-Mars square aspect in late August and early September coincided with a small pullback. While this sextile aspect is considered less harsh than the square, the presence of other unfavourable elements increases the likelihood for bearishness to prevail this week overall. Indeed, we have the possibility for larger declines here because Mercury will station in exact aspect to the midpoint of Saturn and Uranus. There is still some chance for gains this week, perhaps with Monday being the best bet in advance of the Mercury-Mars aspect. Tuesday could well be a reversal day and whatever trend is established then will likely carry into Wednesday. Some rally attempts are more likely Thursday and Friday, with perhaps Friday looking more bullish of the two days. Nonetheless, even if we see early week gains, they will likely be erased fairly quickly. I think there’s a good chance the market will breach the rising wedge support 1030/9600 here and then some — possibly below 1000. If I’ve misinterpreted this week and the gains are stronger than expected, I still think it’s very unlikely they will take out last week’s highs.
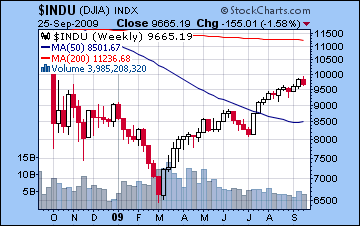 Next week (Oct 5-9) holds significant promise for a major down week. Mercury conjoins Saturn here and while that pairing disappointed last week, the difference here is that it will be that much closer to Rahu’s aspect. At the same time, Mars will conjoin Ketu. This is a very explosive configuration of planets that could move stocks by 10% or more. The following week (Oct 12-16) offers the possibility of a bullish reversal as Jupiter stations and begins to move forward. But with Venus conjoining Saturn and Mars still in range of Ketu, I am not overly optimistic about the immediate prospects for the markets here. Certainly it looks like a volatile week and we could see a retest of the July lows by this time. The second half of October generally looks more bullish, perhaps starting on Tuesday October 20 and the Mercury-Jupiter aspect. Some weakness is likely in November as Saturn moves past Rahu and into range of a square aspect with malefic Pluto. A more substantial rally is likely by the second half of November as Jupiter approaches Chiron and Neptune. This will probably raise the market well into December. All things considered, I don’t expect the interim December highs to be higher than current levels. After that, the market is likely to move down sharply after mid-December on the twin retrograde cycles of Mars and Saturn. This is likely to depress prices until at least mid-January.
5-day outlook — bearish
30-day outlook — bearish
90-day outlook — bearish
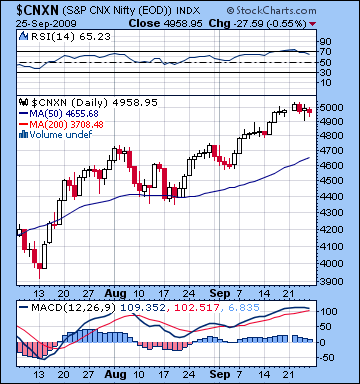 After making new highs early in the week, stocks in Mumbai fell slightly in a week marked by narrow, range bound trading. The Nifty closed at 4958 while the Sensex finished the week at 16,693. As disappointing as last week was, we can take some solace in the fact that the bulls did not take markets significantly higher than the psychological resistance level of 5000. I had expected more negative sentiment on the Mercury-Saturn-Rahu pattern early on but the market edged higher on Tuesday, possibly on the early effects of the Mars-Jupiter aspect. The failure to see any significant decline on the Mercury-Saturn is a reminder of the short term unpredictability of the market when planets cluster into complex patterns as is occurring now. When many planets form geometrically significant angles with each other, pinpointing exact days of manifestation becomes that much harder. To wit, the Sun-Jupiter aspect apparently arrived early as Thursday’s tiny gain may have been enough to counteract Saturn’s pull on Mercury. Friday’s modest decline may have signaled what lies ahead as Mercury is quickly losing velocity before its direct station while in close proximity to Saturn. Overall, our general thesis that the markets are susceptible to retracement in the wake of the Saturn-Uranus aspect remains intact, although just barely. Admittedly, we did see a higher close on Tuesday which might negate our contention that prices are more likely to fall following this aspect. But with bulls unable to take the market higher and the preponderance of fairly negative global cues, the market seems poised to come down further.
Technically, Indian markets are still in a fairly strong position. Last week’s volume was middling and perhaps indicative of uncertainty among traders about future direction as the market negotiates current levels of resistance. RSI suggests a more bearish trend in the making as it is now falling and stands at 65. MACD is something of a bright spot since it has yet to crossover, although its average appear to be leveling off. Of course, as a lagging indicator, it may only show a bearish crossover 2-3 days after declines have begun. Prices remain above the resistance level of the rising wedge at 4800, and that may be one reason why Indian markets have been more resilient than most other global markets here. Unless and until the market breaks below 4800 or thereabouts, that resistance level will act as support. Interestingly, the rising lows of the wedge pattern intersect around that level so support and resistance are closely intermingled. This may therefore amplify the importance of any breaks below 4800 we see here. Overall, the market seems overbought here and due for some kind of correction, although bulls may decide to defend 4800 which is just 3-4% below current levels.
With Mercury reversing its direction after Tuesday’s close, the planetary picture seems again inclined towards bearishness. After Monday’s holiday closure, markets may be weaker on balance over Tuesday and Wednesday. While Mercury’s retrograde period has been disappointingly bullish this time around, we do note that the period near its reversal points (or "stations") can be difficult. This is all the more likely given that Mercury will be in close aspect with Mars for most of this week. Readers may recall that the market took a dip when Mercury formed a square aspect with Mars in late August and early September. The square aspect is generally harsher than the current 60 degree aspect, but the close proximity of Saturn suggests a more negative outcome. Some rebound is possible later in the week, although with Friday’s closure markets this prospect may arrive too late or be fairly weak. Overall, however, I think the market stands a good chance of seriously testing 4800 this week.
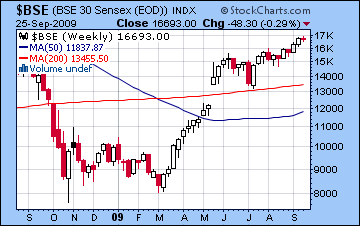 Next week (Oct 5-9) looks even more negative as Mercury again conjoins Saturn but this time with a stronger influence from Rahu. In addition, a debilitated Mars will conjoin Ketu in early Cancer. This alignment is quite powerful and has the ability to take the market down hard. I would not be surprised to see a 10% decline over a two or three day period here. A possible rebound up day may occur on Friday October 9 on the Sun-Jupiter aspect, although that Jupiter influence may serve to simply expand the scope of the bearishness. The following week (Oct 12-16) may see continued volatility on the Venus-Saturn conjunction but the chance for gains increases after Jupiter turns direction on Tuesday October 13. The second half of October seems more positive as the favourable aspects appear to outnumber the malefic ones. For example, Jupiter first aspects Mercury on October 20 and then Venus on October 28. This rally should continue into early November after which we should see some selling on the Saturn-Pluto square. The planets again turn bullish after November 17th or so, so prices should again climb into December. A more bearish period is likely to begin after Mars turns retrograde on December 19.
5-day outlook — bearish
30-day outlook — bearish
90-day outlook — bearish
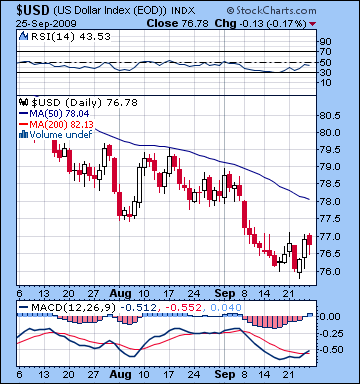 The dollar may have finally found its mojo as it recorded its first weekly gain in a month. After trading as high as 77 on Thursday, it closed around 76.8. Tuesday’s sharp decline was a little puzzling given the Mercury-Saturn conjunction, although perhaps the Mars influence on the natal 8th cusp explained part of the weakness. Wednesday and Thursday saw the biggest gains and corresponded with the Sun’s approach to the natal Midheaven. The snail’s pace of this reversal can perhaps be attributed to Ketu’s aspect to the natal Sun, which finally moved past exact last week. Technically, the dollar is looking stronger. RSI stands at 43 and still in bearish territory but is moving towards the 50 level. More significanly, MACD is a bullish crossover and has turned higher. While still contained by the falling wedge pattern, the dollar seems poised to break out higher above the resistance level of 78. This also corresponds the 50 DMA and therefore should be considered doubly important from a technical perspective.
With Ketu now moving past the Sun last week, this week may finally see more genuine upward movement as the Jupiter influence to the ascendant begins to dominate. The Sun will exactly conjoin the natal Midheaven on Monday and Tuesday so that should help to boost the dollar into the limelight. Prices may stay strong into Wednesday and even Thursday as transiting Venus opposes the natal Moon. There is some possibility for a sell off on Thursday and Friday as Venus squares natal Mercury. Overall, there is a very good chance that the dollar will rise above 78 at some point this week. Further gains are likely next week ahead of the Jupiter station as the Sun will transit the 11th house of gains. These could well see the dollar push much higher, perhaps towards 81-83. Some significant pullback is likely in the second half of October as transiting Saturn will aspect the Sun. Saturn will square Pluto in November and then take up residence very close to the natal Midheaven in January. Both of these placements are likely to correspond with bullish moves in the dollar.
With the growth of financial uncertainty, the Euro fell back a bit last week to close at 1.467. As expected, the Mars to Mars square suppressed prices on Thursday although the Mercury-Saturn opposition to Jupiter did little to dampen enthusiasm. This decline was weaker than expected, mostly due to the beguiling effect of Mercury and Saturn. In the past month, I have been consistently disappointed by the inability of the Saturn aspect to both the natal Jupiter and the natal Moon to drive down prices. Saturn is clearly a bearish influence, but for some unknown reason it has yet to deliver its negative payload. This week is another strong candidate for declines as Rahu moves into a square with the natal Saturn while Saturn approaches the ascendant. This double dose of Saturn should be enough to continue the move down. The declines would appear to be steeper next week given the Mars-Ketu aspect to the natal Venus in the Euro chart. Some recovery will occur in late October owing to the Jupiter aspect to the natal Mars. But the Euro should be unable to undertake a significant rally until late November after the worst of the Saturn-Pluto square has passed. The Indian Rupee finished largely unchanged last week closing at 48.14. Some weakening is likely this week and next as 49 may be breached.
Dollar
5-day outlook — bullish
30-day outlook — bullish
90-day outlook — bullish
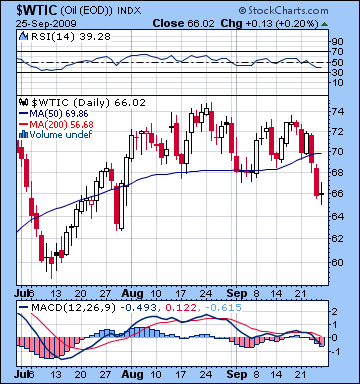 As expected, crude oil fell sharply last week closing around $66. We did see a sizable loss Monday on the Sun-Neptune aspect, although crude rebounded on Tuesday. Significantly, it did not quite equal Monday’s close and the stage was set for further selling. Crude broke through support at $68 on Wednesday and Thursday as the full effects of the Mercury-Saturn conjunction began to be felt. The late week rebound on the Venus-Venus aspect fizzled as Friday barely saw crude hold its own. The technical picture looks even more compromised here as prices have fallen below support in the wedge pattern and the 50 DMA. RSI is a bearish 39 and falling while MACD is even more clearly negative as averages have now turned downwards. The next support levels are $60 and $63, both lows recorded in July. $60 would complete the retracement of the bearish head and shoulders pattern.
This week looks like more of the same as crude may retest its July lows. Mercury’s station in close proximity to Saturn near the 4th house cusp of the Futures chart does not generally indicate higher prices any time soon. Moreover, Mars will cast its aspect to Mercury just as both are moving forward at the same speed, suggesting an extended period of mutual influence. This is not to say the market will fall for several days running, but the unusually long time when both planets are in aspect with each other makes it harder to distinguish possible up days from down days. We could see a gain Monday or Tuesday as the Moon approaches Jupiter but it does not look particularly solid. Friday may also be positive given the Sun’s minor aspect to Uranus in the Futures chart. The bottom could really fall out of crude next week as Saturn aspects the natal Rahu in the Futures chart. The negative energy from this aspect may not manifest exactly on cue, but it does suggest that crude could fall a lot further in October before it recovers.
5-day outlook — bearish
30-day outlook — bearish
90-day outlook — bearish
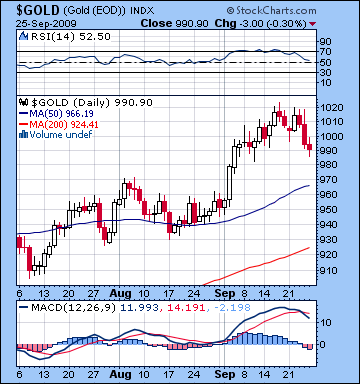 After trading near $1020 on three separate days last week, gold bulls finally relented as bullion closed 2% lower at $990 on the continuous contract. I had wondered if we would get a spike up in the early week and gold did rise above $1015 on Tuesday. Wednesday’s Sun-Pluto square was fairly bearish as we anticipated it might be and Wednesday saw another attempt to move higher before the bulls lost their nerve and gold closed down. RSI is barely bullish at 52 but is trending lower. MACD has now turned clearly negative the late week losses have produced a bearish crossover. While gold still trades above its 50 DMA ($966), its next level of support may be the bottom line of its recent upward channel around $980. Prices below that level may embolden bears to take more aggressive action. Nonetheless, there would appear to be a fair amount of support at $940-955 so that is likely going to be a more significant level of retesting before it can make any other downward moves.
This week could see gold retest some of those lower support levels as Mercury reverses direction in close proximity to pessimistic Saturn. While this ought to provide enough bearish fuel here, the gold ETF chart presents a somewhat more mixed picture ahead of next week’s disaster scenario. Both Mercury and Saturn sit high up in the natal chart which is usually a favourable placement. The problem there is that Saturn is likely a negative influence because of its awkward natal placement in the 8th house. Moreover, Saturn (2 Virgo) will now closely aspect the natal Sun (2 Scorpio) so that ought be enough to take gold down again, perhaps sharply. Some kind of gain is possible on either Tuesday and Friday, although I would not expect much lift. Next week could well be a mini-armegeddon for gold as Mars and Ketu will conjoin exactly on the natal Saturn. This is a very negative combination and has the potential to take gold down 5% in a single day. October seems quite bearish for gold with recovery coming late in the month and into November. Even allowing for some rebound into December, gold seems destined to make another major move down starting in mid-December. Mars turns retrograde on December 19 in very close opposition to the natal Moon in the ETF chart. Moreover, Saturn turns retrograde in a close 135 degree aspect to this Moon on January 13. So if we see gold correct down to $900 in October with a rebound to $950-1000 by December, this early 2010 decline looks like it could take gold down even lower than anything we might see in October.
5-day outlook — bearish
30-day outlook — bearish
90-day outlook — bearish

