- Stocks likely to move lower, possibility of large move down
- Dollar to rise this week; new rally begins and will last into September
- Crude oil to weaken towards $70 this week; new correction phase could extend into September
- Gold looks very fragile as Venus enters Virgo; significant move down is likely in coming weeks
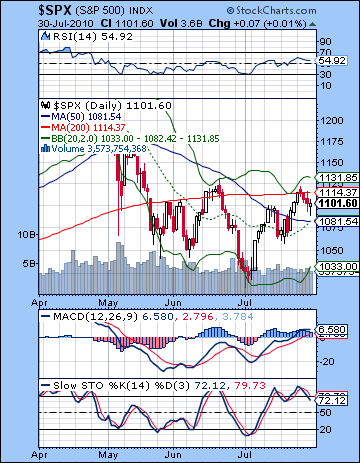 It was a purgatorial sort of week as bulls and bears fought to a draw with stocks edging higher in the early going only to slide back to mostly unchanged by Friday. The Dow ended up slightly to close at 10,465 while the S&P was down a point to 1102. This was a somewhat frustrating outcome although not one that I was totally unprepared for given the mix of aspects in play. On a positive note, Monday’s Saturn-Uranus opposition may have marked the top of the current trend as Monday saw the highest close of the week with the intraday high of 1120.arriving on Tuesday. Of course, to what extent the Saturn-Uranus opposition has done its job will depend on what happens in August and September. I had noted the possibility of an early week gain on the Sun-Jupiter aspect and that is what we got as bulls moved the S&P back above 1100. I mistakenly thought that Monday’s Mercury-Mars aspect might tilt the scales towards the bears, but that would have to wait until Tuesday’s close. Certainly, the rest of the week after Monday did have a topping feel to it since we got a succession of lower intraday lows on each day. Friday’s intraday low of 1088 was the lowest on the week and tested the rising trendline from the July 2 low. For all their resilience, the bulls are unable to decisively break above the 200 DMA in the S&P chart and the previous high of 1131 lies just out of reach. At least, the bears can take some comfort in the fact that the market did not rise all the way into Friday’s Mars-Saturn conjunction. Despite the absence of any big down days, the other constructive take away here was that Jupiter does appear to be weakening. I had noted how the start of Jupiter’s retrograde cycle on Friday, July 23 might signal the beginning of the end of the July rally that was focused around Jupiter and its aspect with Pluto. Since that Jupiter-Pluto aspect completed on Sunday July 25, it may have opened the door for more cautious or even fearful Saturn energy to manifest. The inability of the market to break above any more significant resistance levels was testament to that potential changing of the celestial guard as Jupiter may have been supplanted by Saturn in the past week. Since we didn’t get much downside last week, this somewhat lessens the likelihood of an August crash. It’s still more likely than it has been through much of July, but I am less confident we have enough bearish planetary fuel in the tank here for a full blown crash (i.e. >10% in a single day). A decline is still the most probable outcome but it may not have enough to wipe the slate clean in one fell swoop. Saturn is still the prevailing energy here, and Saturn is most associated with declines and pessimism. The Mars-Saturn conjunction on July 31 is key since it sets up the possibility of a major leg down in the coming weeks. Research conducted in the 1970s by Thomas Rieder suggested that a major (>20%) protracted downdraft in the market would tend to occur whenever: 1) Mars conjoined a slow moving outer planet and 2) this conjunction was in square or opposition aspect with another outer planet. Based on his historical research, this combination of factors led to a 70% chance of a large decline. The current situation satisfies the conditions of his hypothesis since Mars is conjunct Saturn while in opposition to Uranus and square Jupiter and Pluto. The aspects are extremely close and the number of aspects involved higher than normal, so we might therefore increase the likelihood of the predicted outcome. After the Mars-Saturn conjunction, Saturn will then approach its opposition aspect with Jupiter on August 16, and then form a square with Pluto on August 21. It will be a busy month for Saturn, and presumably for the bears also.
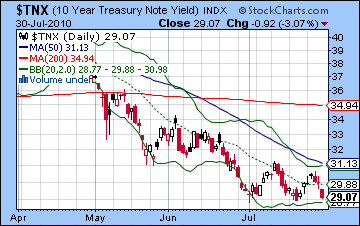
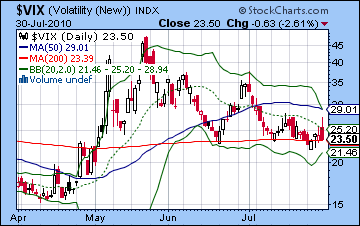
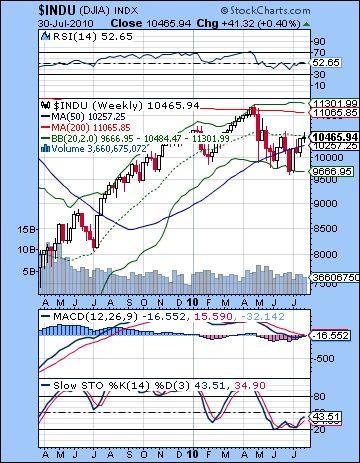 The technical picture became more complicated as a result of last week’s action. After the bulls successful take-out of the falling trendline from the April high, they did not offer much follow through on the upside as they failed to break above the 200 DMA on the S&P at 1114. Monday and Tuesday saw attempts to defeat that key level of resistance but in the end, it was not accomplished. Even more importantly, the previous high of 1131 remained unchallenged. As long as this previous high stands, bulls will not be able to scale the ascent back to 1200. The early week rise towards 1120 was close enough to the top of the Bollinger band to compel some traders to take profits from the recent advance. This is another reason why prices may be headed lower, at least in the near term. And yet for all that, bulls can rightly point out that they have pushed prices above the 50 DMA (1081) and despite Friday morning’s opening bell selloff after the GDP data, the rising trendline off the July 2 remains intact. This is a steeply rising line and hence it is unlikely to endure, but the successful defense of this line (at 1088) nonetheless gives the bulls some credibility. The market is therefore trapped in a narrow range between the 50 and 200 DMA with the next move apparently decisive one way or another. The technical indicators are mostly unchanged from last week and still suggest a bullish bias. Stochastics (72) have once again fallen below the overbought line so that may signal the start of a larger move lower. The weekly Dow indicators continue to look weak and suggest further weakness in the intermediate term. More intriguing is that the bond market appears to be betting on a double dip recession. Yields on the 10-year treasury fell sharply after the GDP miss on Friday and approached their July lows around 2.90%. So this sets up a divergence between the bond market and the stock market over the future economic direction. Bond yields and stock prices usually march in tandem but stocks have risen some 8% above their early July low whereas bonds have returned to that level. In the battle of the markets, bonds usually carry the day if only because the capital involved is that much larger. In this respect, the falling bond yields are an important factor in the bear argument. Before they do anything else, bears will have to break the trendline at 1088 on the S&P and then there will be more rapid selling. Possible support is likely around 1050 which will form a possible right shoulder in an inverted head and shoulders around the July 2 low. This would be a bullish pattern that would bring more buyers into the market. If 1050 does not hold, then the bears are off to the races and we will get a probable retest of 1010 quite soon afterwards. But if 1050 does hold, then we can look forward to more sideways moves through the middle of August and into late August. Barring some disastrously bad economic developments next week (which always possible here but we cannot count on them), I would expect 1050 should hold initially. For their part, the bulls need the market to close above 1131 for their case to gain any substantial traction in the near term. If this should happen, there will be a wave of short covering that would coincide with a new range between 1131 and 1170. I don’t expect this to happen, but it is something to watch out for.
 This week we will discover just how important that Mars-Saturn conjunction was for the markets. With Saturn-Uranus behind us, there is a good chance that the bears will rule the roost here. In addition, Venus enters Virgo on Monday so that should be another drag on sentiment. Venus, the planet of happiness and spending, is considered debilitated in Virgo so this may make buyers a little less enthusiastic, especially since it will join Mars and Saturn there. Like last week, there is a high density of aspects that makes daily moves somewhat harder to call. Monday seems more likely to be negative given the new Venus influence in Virgo, although a higher morning open is possible given the minor aspect from the Moon to Jupiter. Tuesday is perhaps more interesting astrologically since we will have a somewhat bearish Sun-Rahu aspect on the same day as a potentially bearish Mars-Jupiter-Pluto alignment. Aspects to this Jupiter-Pluto square have been bullish through most of July, so it is quite possible this Mars aspect could spark a wave of buying, especially if Monday is lower as expected. Mars-Jupiter oppositions are often coincident with "excess spending", so we should at least expect some wild swings in both directions on Tuesday and into Wednesday. The late week period looks more bearish again as Venus comes closer to its conjunction with Saturn while Mercury moves into aspect with unpredictable Rahu. Mercury may be the key to this whole alignment since Venus, Mars, and Saturn are in sidereal Virgo, a sign that Mercury owns. Mercury’s affliction by Rahu, therefore, could release a lot of energy. A big down day (or two) are therefore more likely on Thursday and Friday. Overall, the week looks bearish with the possibility of a large move lower and a retest of the July 2 low. At this point, it seems like a stretch, but these planets can pack a punch that should not be underestimated. One possible outcome might be a down day Monday that pushes the S&P to 1060 and then a failed rally attempt into midweek that goes back and kisses the rising trendline at 1088 good-bye. We would then finish the week somewhere between 1000 and 1050. Admittedly, that’s a huge range but it’s important to keep all possibilities on the table just in case.
 Next week (Aug 9-13) will begin in the immediate aftermath of the Venus-Saturn conjunction. This looks like a bearish start to the week as Venus (9 Virgo) will be "hemmed in" between malefics Mars (11 Virgo) and Saturn (7 Virgo). Some rebound is possible in the middle of the week although Friday could be negative again as the Moon enters Virgo and thereby joins the bearfest there with Saturn, Venus and Mars. A positive outcome is possible in this week although there is still a possibility for a large down day early in the week that could upset that expectation. The following week (Aug 16-20) may begin positively but the bearish effects of the Jupiter-Saturn opposition on Monday will have to be felt somewhere close by. It could conceivably wait until Tuesday or Wednesday of this week although don’t bet on it. The end of August will likely see the bears continued dominance in the market as Venus moves in conjunction with Mars for an extended period. Normally, Venus moves faster than Mars so their bearish aspects are one or two days affairs at most. On this occasion, however, Venus is slowing down in advance of its retrograde cycle in October so that means that Mars will be able to have a greater influence and thereby squeeze out spending impulses. I am expecting some kind of interim low around Labor Day with a one or two week recovery period before another bearish phase at the end of September that may extend into the beginning of October. In terms of levels, a more bullish scenario would be a decline to 1050 this week (by August 6) then sideways between 1040 and 1100 until mid-August. Another dip down into Labor Day to 1010 and then up to 1060 by mid-September followed by a decline to 975 into early October. However, a more bearish scenario is more likely to play out. That would be an early August low of 1000-1040 followed by a brief rally attempt to 1070 in mid-August and then down to 975 by Labor Day. Then up to 1040 by mid-September, and then down hard to 920 by early October. It could well go lower than that (800?), but let’s see how much damage we have this week on the heels of the Mars-Saturn conjunction.
5-day outlook — bearish SPX 1000-1050
30-day outlook — bearish SPX 975-1000
90-day outlook — bearish SPX 900-1000
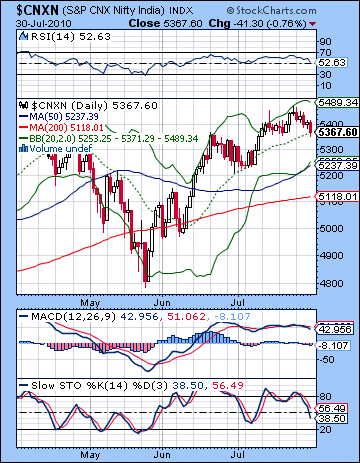 Stocks closed lower on Dalal Street last week on earnings disappointments and continued global economic uncertainty. Prices fell on three days out of five as the Sensex finished at 17,868 while the Nifty ended Friday at 5367. While this decline was welcome news after the three consecutive winning weeks in July, it fell short of my expectations. I thought we might see more downside around the RBI hike but the 50 point surprise hike did not pan out. As a result, Monday’s anticipated decline on the Mercury-Mars aspect arrived but losses were fairly muted — less than 1%. After a small gain Tuesday, the bears again took control Wednesday as Mars moved to within two degrees of Saturn. As expected we saw some limited gains towards the end of the week and the Moon-Venus aspect as Thursday’s session produced minimal upside. Friday was down again as the Moon opposed both Mars and Saturn. So no big down days, but at least our hypothesis of a potential market top is intact. For the past few weeks, I had noted that the Saturn-Uranus opposition that came exact on Monday 26 July could well mark an important interim top. A top occurred in late April on most global markets at the time of the previous Saturn-Uranus opposition. This time around the most recent high was put in on Friday 23 July — just one trading session before the exact Saturn-Uranus aspect. Moreover, that high point coincided exactly with the Jupiter retrograde station. As we know, stations describe the change in direction of planets and they can correspond with changes in market direction. Jupiter’s retrograde cycle and its aspect with Pluto therefore may mean that the optimistic energy of Jupiter could finally be subsiding as pessimistic Saturn takes greater control of market sentiment. Certainly, last week’s Saturn-Uranus is one reason to expect that further declines lie in the near future. We note that Saturn plays a greater role in most of the key planetary aspects upcoming. Mars exactly conjoins Saturn on Saturday 31 July and this combination of two malefic forces could very well increase the tilt towards the bears in the near term. Indeed, some historical research conducted by Thomas Rieder in his book Astrological Warnings and the Stock Market suggests that the current configuration is strongly pointing towards a major stock decline. Rieder found that there was a 70% chance of a major decline of 20% or more would follow whenever: 1) Mars conjoined a slow moving outer planet and 2) this conjunction was either square or opposite another outer planet. Outer planets are defined as any planet that lies beyond Mars, that is: Jupiter, Saturn, Uranus, Neptune and Pluto. This is precisely the situation we now have. Mars is in conjunction with Saturn while at the same time opposite Uranus AND square Jupiter and Pluto. In fact, since these aspects are particularly tight and there are so many of them, his research indicates that the probability of the bearish outcome is thereby increased. Of course, he was working with a fairly limited number of cases (<20) but it nonetheless supports my expectation that markets are more likely to fall in the months ahead. After the Mars-Saturn conjunction, Saturn then opposes Jupiter on 16 August, and then square Pluto on 21 August. Saturn’s final major aspect will occur in its square with Rahu on 27 September.
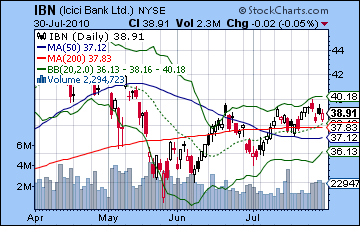
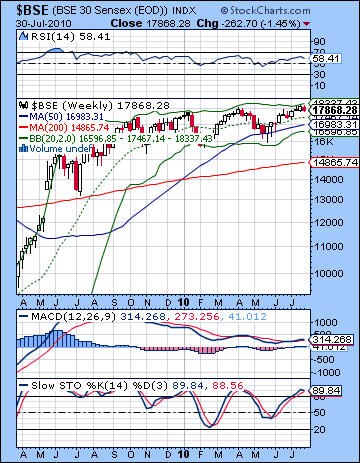 The technical situation is now more evenly divided between the bulls and the bears. Perhaps the most important development for the bears is that the rising trendline off the low of 25 May has now been violated on the downside. While this trendline was steep, it nonetheless was tested no less than four times over the past two months and for that reason, its failure is very significant. As in mid-June, prices have retreated to the 20 DMA in the middle of the Bollinger band. What makes that support less likely to hold this time around is that the trendline has now been broken. For this reason, an immediate retracement back towards the bottom band is likely, around 5250. Daily MACD is in a negative crossover now and appears to be on the verge of rolling over. RSI (52) is falling, although it does not feature any obvious divergences. That is at least something the bulls can point to to support their case. Stochastics (38) are falling sharply and seem destined for the oversold area below 20. As difficult as the situation is, however, the bulls can still note that both the 50 and 200 DMA are rising. This is an important technical indication of a bull market and until prices either fall below the 200 DMA, Indian stocks will continue to attract buyers. In that sense, bears may have to wrest control from the bulls in stages. First, take prices back below the 200 DMA and then keep prices down long enough that the 200 DMA itself begins to slope downward. The weekly BSE chart indicators remain somewhat bearish as negative divergences are evident in both the MACD and RSI. Stochastics are in the overbought zone and will turn down if this week is negative as we expect. What’s also worth noting that prices touched the top of the Bollinger band resistance area about 18,300. This is another indication that some kind of correction is in the cards. Volume remained moderate to low last week ranging between 12k and 17k for the BSE. Down volume is more prominent in the New York chart of ICICI Bank (IBN) suggesting that sellers may be planning their escape. Last week saw a significant rise in volume on the downside as prices have similarly come off the top of the Bollinger band. We can also spot the development of a large triangle pattern as price movements have become progressively smaller here. These triangle patterns may resolve in either direction, although I expect prices to fall in the near term. In the event of a decline next week, we should expect some resistance near the 50 DMA around 5250. Below that, the 200 DMA at 5100 will also bring in new buyers.
This week looks mostly bearish again in the aftermath of the Mars-Saturn conjunction. An added negative factor is that Venus will enter Virgo on Monday in advance of its own conjunction with Saturn later in the week. Venus is a planet associated with happiness and spending but it does poorly in Virgo. This is likely to reduce willingness to buy, especially since Mars and Saturn are already in Virgo. The Moon is in Aries early in the week so this may translate into rapid and sometimes ill-thought out decisions that could represent investors trying to leave the market. Some midweek gains are possible as Mars forms an alignment with both Jupiter and Pluto. This is closest on Wednesday although it could manifest on Tuesday. Throughout much of July, any transits to Jupiter-Pluto have corresponded with gains. This Mars aspect may do likewise, although there is reason to be skeptical here since Jupiter looks weaker. Late in the week, Mercury will be aspected by Rahu. This seems like a disruptive influence that could push prices lower again. Friday seems somewhat worse than Thursday. So overall there is a good chance the Nifty could test that lower Bollinger band at 5250 this week. It’s possible it could fall below that level, but I would like to err on the side of cautious conservatism here.
 Next week (Aug 9-13) looks like more volatility although sharp drops and quick rises are both possible. Venus will be "hemmed in" between malefics Mars and Saturn for much of the week so we should retain a bearish bias here. However, Monday could well be positive as Venus forms an alignment with Jupiter. Wednesday looks more negative on the Moon-Mercury conjunction in Leo. Friday also seems to tilt towards the bears, especially at the close, as the Moon conjoins Venus and Mars. The following week (Aug 16-20) will also have some significant down days as Jupiter opposes Saturn on Monday while Mars and Venus set up in a close square with Rahu. This latter aspect will be closest on Monday and Tuesday. What makes this period more problematic is that Venus itself will conjoin Mars for an extended period. Normally Venus only suffers form the influence of Mars for a day or two as the faster velocity of Venus carries it out of harm’s way fairly quickly. But Venus is slowing down in advance of its retrograde cycle which begins in October and hence it will come under the affliction of Mars for much longer. This will likely exert an ongoing negative influence in late August and into September. While the markets are unlikely to go straight down from here, the bearish appears to outweigh the bullishness through August and September. For this reason, I am expecting a significant retracement to occur. A more bullish scenario would see a modest decline this week to perhaps 5250 then a failed attempt to rally back to previous highs by mid-August, perhaps to 5400. This would be followed by more downside towards 5000-5100 by early September and then another rally attempt to perhaps 5250. Finally, a major decline would coincide with the Saturn-Rahu aspect in late September that would drop the Nifty close to 4500-4700. A more bearish scenario would follow a roughly similar pattern but would be 5-10% lower. So the late September-early October target would be closer to 4000.
5-day outlook — bearish NIFTY 5150-5250
30-day outlook — bearish NIFTY 5000-5200
90-day outlook — bearish NIFTY 4500-5000
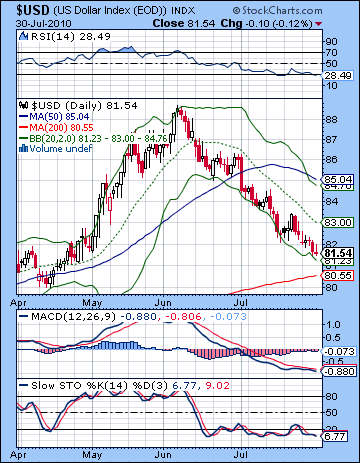 The Dollar stayed in the doghouse for yet another week last week as there remained too many reasons to avoid it and not enough reasons to own it. Despite some early week strength, it lost another cent closing below 82 for the first time since April. I had kept my expectations pretty low here, but even those were underwhelmed by the greenback’s performance. I confessed that the bullish patterns seemed somewhat lacking in the USDX horoscope and I suppose that skepticism was borne out. As expected, some mild gains occurred early in the week on the Mercury-Mars aspect to the natal Sun but these were erased by the Mercury-Jupiter aspect later in the week. I had expected the ship to begin turning around after Jupiter turned retrograde on July 23 but so far nothing much has happened. The decline is still adhering to a fairly steep falling channel which has followed the bottom of the Bollinger band with the 20 DMA acting as resistance. We can see some signs of hope in the technicals as a double bottom is evident in the RSI thus indicating a positive divergence. MACD histograms are similarly shrinking despite continued lower prices. It seems that the Dollar on the verge of bottoming out. Stochastics (7) remain hugely oversold although in a protracted decline, this can go on for a long time. Nonetheless, there is good reason to expect the Dollar has found support here since it remains above the 200 DMA at 80.55. The 81-83 level also corresponds with the prevailing range at the beginning of 2010 and so there will be a lot of volume support here. And with the 200 DMA still rising, there is still a bullish case to be made here, despite its recent retracement. A break out of this falling channel would act as shock therapy and would likely start a bull move higher.
This week looks more promising for the Dollar as Venus moves into Virgo. This is likely to produce more risk aversion which could make the Dollar more attractive. Monday looks good as does the late week as the Moon enters Gemini and receives the full force of Saturn’s aspect. Early next week also looks somewhat positive as Mercury sits high in the USDX chart. I am expecting the deeper move into Virgo by Venus and Mars to accompany further strength since Virgo is the 11th house of gains. By late August, the rise should be accelerating so that we could easily see a rebound to 84 by the end of the month. September will probably see further upside with 86-88 possible by the end of the month. The wheels will start to come off in October as Saturn moves deeper into Virgo and starts to eat away at all those 11th house gains. The most bearish time for the Dollar will be November, December and January as Saturn will station in close aspect to the ascendant in the natal chart. This will have a doubly negative effect since Mercury is also there. I am expecting a big selloff to occur over these three months, probably more than 10% and possibly as much as 20%.
Meanwhile, the Euro continued to add to its recent winning streak closing above 1.30. Much to my disappointment, the Mars-Saturn conjunction did not manifest any negativity here as Jupiter’s aspect to the ascendant continued to keeps things afloat. Now that the aspect has past, the situation may begin to unwind a little bit. Let’s see what effect the arrival of Venus to Virgo has on the Euro chart. Thus far, the ascendant has been made near impermeable by Jupiter’s aspect but one wonders how long that can last. By the end of the week and the Mercury-Rahu aspect, I think we will see the Euro back under 1.30, perhaps under 1.29. Look for this retracement lower to gather steam going into September. 1.19 seems like a stretch at the moment but anything is possible here. The Rupee gained some ground last week on the RBI rate hike closing at 46.4. Weakness is more likely going forward here with 47 possible by Friday.
Dollar
5-day outlook — bullish
30-day outlook — bullish
90-day outlook — bullish
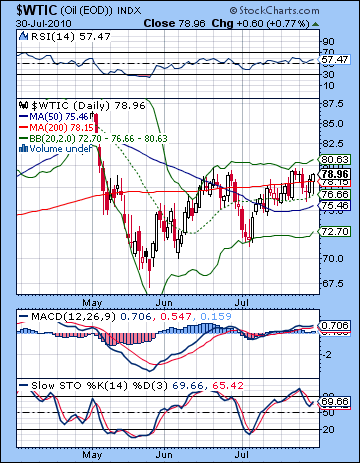 Despite early week bearishness, crude rebounded once again and closed unchanged on the week just under $79 on the continuous contract. I had been more negative here but underestimated the ability of prices to bounce back. As expected, prices slumped early on as the Mars transit to Rahu in the Futures chart pushed crude down to $76 by Wednesday. However, as has been the case recently, the 20 DMA offered decent support and it moved back up on Thursday and Friday. This rise was not entirely unforeseen as I had noted the potential for gains on the Mercury-Jupiter aspect at the end of the week, but I could not fully bring myself to believe it could out-muscle the approaching Mars-Saturn conjunction. This is the third time in the past month that crude has attempted to climb above $80 but failed. Clearly, this is becoming important resistance. Prices also seem unable to move beyond the upper Bollinger band here and that is another reason that the downside risk seems larger than any upside potential. The general technical outlook is still poised to make a major move as prices are congealing around the 200 DMA at $78. This line is still slightly rising so the bulls can point to that underlying momentum and we can see that the 50 DMA is now rising once again suggesting a possible intermediate bullish orientation. MACD is also in a bullish crossover and there is no evidence of any divergences yet. RSI (57) is rising and also lacks any divergences that might warn of a near term correction. Stochastics (69) may be in a larger negative phase here as they have not returned to the overbought area. Significantly, we can discern a divergence here as prices have matched highs of last week but stochastics are noticeably lower thus pointing to a weakening in the near future. While immediate support is around the $75-76 level and the 20/50 DMA, the bottom Bollinger band ($72) may well be tested in any decline that may occur in the next two weeks.
Crude looks bearish this week as speculators may become more inhibited as Venus enters Virgo. We could nonetheless see a gain on either Monday or Tuesday as the Sun sets up in favorable aspect with the natal Jupiter-Uranus conjunction in the Futures chart. Possibly Tuesday is more positive here although it’s fairly indefinite. Wednesday may also have a positive tinge to it as the Moon enters Taurus, its sign of exaltation. The late week period seems more bearish again with Friday shaping up as the most negative with the Moon entering Gemini. Next week may have an unsettled beginning with a good chance for recovery by Thursday. Friday the 13th (!) seems more bearish again as the Moon conjoins both Venus and Mars. Crude will likely consolidate over the next several weeks as prices move lower. The picture may improve in October and November if only because of a falling US Dollar.
5-day outlook — bearish
30-day outlook — bearish
90-day outlook — bearish-neutral
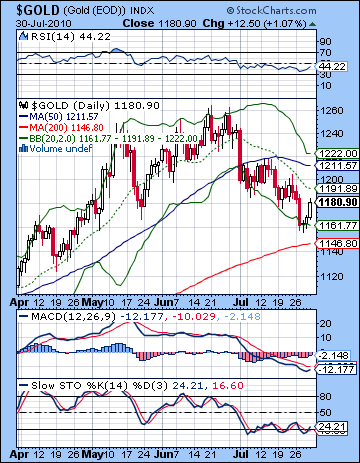 Gold continued to lose its luster last week as it closed lower at $1180 on the continuous contract. Gold sold off sharply on Tuesday in the aftermath of the Sun-Jupiter aspect and then climbed back somewhat at the end of the week. This result was not too surprising as I had been fairly neutral given the possible offsetting energies in play. The late week recovery coincided with the Mercury-Jupiter aspect and once again revealed the ability of Jupiter to increase demand for the yellow metal. The technical picture continues to languish here as the bounce merely pushed off the lower Bollinger band. Since the initial plunge off the highs on July 2, previous rally attempts have followed a bear flag pattern: each leg down brings some sideways action that retraces part of the fall only to fall again to a new low. The 20 DMA ($1191) is serving as significant resistance here as rebounds have not managed to climb above it. This should therefore be considered important resistance this week. The intermediate indicators are looking quite weak for gold as both the 20 and 50 DMA are now falling. MACD is showing signs of turning higher although it remains in a bearish crossover. RSI (44) got a shot in the arm last week but it still falling through July. Stochastics remain deeply oversold and we can see it attempting once again to move higher. If gold falls further from here as we think it might, the next level of support would be around the 200 DMA at $1146. Gold bugs can take heart that the 200 DMA is still rising and thus offers some evidence for higher highs down the road, but a breakdown of this level would be catastrophic and lead to sharply lower prices, perhaps leading to a retest of $1000.
This week looks more difficult for gold as Venus enters Virgo. Venus is a key planetary indicator for gold and when it is weak or afflicted, enthusiasm for owning gold suffers. Since Venus is debilitated in Virgo, this is likely to put further pressure on prices. And with Venus joining Mars and Saturn in Virgo, the possibility for declines increases. Monday will be the first sampling of this new Venus in Virgo energy so I would expect bears to carry the day there. The week may not be all negative, however, due to the Mars-Jupiter aspect on Tuesday and Wednesday. Friday looks more bearish again as the Moon enters Gemini and receives Saturn’s full aspect. It’s very possible we could see a test of the 200 DMA here with prices dipping to $1150 or lower. The outlook for gold seems mixed to negative through much of August since Venus will begin to move in tandem with Mars. This ongoing conjunction will run into October and will tend to push prices lower. We will see some rally attempts after the Sun enters Leo on August 17, but I am fairly bearish on gold in the near term. Gold may form a significant low in late September or early October around the Saturn-Rahu aspect and then move sharply higher. This rally could last into November and into 2011 as the US Dollar will likely weaken substantially at that time.
5-day outlook — bearish
30-day outlook — bearish
90-day outlook — bearish

