

- US Stocks more bearish this week ahead of Mars-Saturn conjunction; next phase of correction looms; Indian stocks bearish this week on likely RBI rate hike
- Dollar may stabilize this week with some upside possible; sustainable rally likely into September
- Crude to correction sharply this week; new correction phase could extend into September
- Gold looks increasingly bearish although some up days are possible this week; August is bearish
Stocks in New York climbed 3% last week fueled by positive corporate earnings and mollifying effects of the European bank stress test results. Despite Tuesday’s intraday test of 10,000, the Dow closed Friday at 10,424 while the S&P finished at 1102. My worst fears were realized as the bulls made a successful run at 1100 and held off the increasingly weakened bear forces. Monday’s failure to go lower was perhaps the first clue that we would have a positive week and not even Mars’ entry into Virgo was enough to keep prices depressed as an afternoon rally pushed stocks into the green. Venus-Rahu was part of the bullish about face although it showed up a little later than expected. The moral of the story was that Jupiter is still in charge of sentiment as it is highlighted in two key patterns. First, the Jupiter-Pluto square aspect has been a central element of this July rally and that is exact on Sunday July 25. Aspects *usually* weaken after exactitude so that is one indication that perhaps the bulls may have a tougher time this week. Both planets are moving very slowly, however, so there is a possibility that some bullish Jupiter sentiment could linger here, especially to fill the spaces when Saturn is less pronounced. Second, Jupiter began its retrograde cycle on Friday morning, July 23. Although stocks continued to rise immediately after this change in direction, this may be another important marker for price direction going forward. We will have to pay close attention to the condition of Jupiter in the days ahead. But the good news for the bears is that Saturn is poised to take a more prominent role in the sky. On Monday, we will see the final Saturn-Uranus opposition. The exact opposition takes place in the afternoon so it’s quite possible we could see some immediate manifestation of this pattern. It is critical to recall that the same opposition of Saturn and Uranus took place on April 26 — the very same day the main market indexes made their highs for the year. While "past results are no guarantee of future performance", this is an important building block for the bearish cause. Once the opposition is past, Saturn will then train its sights on Jupiter, as the planets of pessimism and optimism are due to oppose one another on August 16. The last Jupiter-Saturn opposition took place in the midst of the initial correction phase on May 22 and this is usually a negative influence on sentiment. The parade of important aspects involving slower moving aspects continues as Saturn forms a square aspect with Pluto on August 20. Both of these planets are considered malefic, although their aspects do not always produce price declines. In this instance, however, the situation seems more negative given the proximity of Jupiter and Uranus. We shall see. On a more positive note, Jupiter will conjoin Uranus on September 18 so that may coincide with an uptrend, or at least the culmination of an uptrend of indefinite duration. Last but not least, we will see Saturn square Rahu on September 27. These two planets do not often produce good vibes. For example, the most precipitous decline in the October 2008 meltdown coincided closely with a Saturn-Rahu aspect. While there were other unpleasant aspects in play then, this upcoming Saturn-Rahu combination is likely to weaken sentiment to some extent and could well an important market bottom.
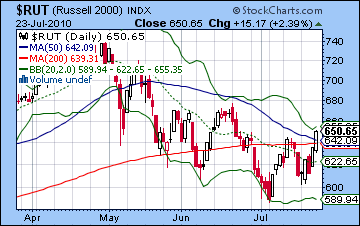
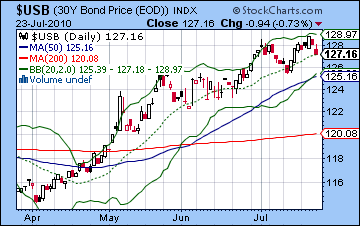
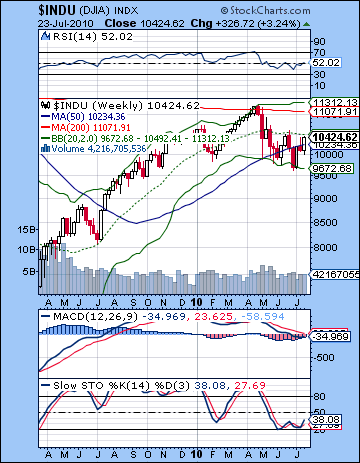 From a technical perspective, it was a torturous week for bears. The falling trend line (at 1090) from the April high was broken to the upside. This shook out some of the bear tourists from their easy short positions. Friday’s close at 1102 equaled the left shoulder from June 5 of the mini head and shoulders pattern and even set up the possibility of challenging the 200 DMA at 1113 with the June 21 high of 1131 not too far in the distance. Volume was still quite light so it was hardly a resounding vote of confidence for the rally but this run up has nonetheless caused a lot of consternation in the bear camp. Since the short side was getting too crowded this was perhaps a much needed development before prices take another tumble. If everybody is short, there is no longs left from which to borrow shares! Daily MACD has crossed above the zero line and the bullish crossover and positive divergence continue to suggest more upside is possible. RSI (56) is still trending higher while Stochastics (86) are back in the overbought area. The bears can still point out that the 200 DMA (1113) is still acting as resistance here since it tends to mark the dividing line between bull and bear markets. The presumed last line of defense for the bears is the previous high of 1131 since any trades above that level would constitute a higher high and therefore break this bearish sequence of lower lows and lower highs. Treasuries remain safely above their break out level as the 30-year is currently sitting on the supporting trend line. A break below this level would signal a shift of money out of bonds and into equities. While the stock rally has been noteworthy, there are some signs that breadth may be lacking. The small cap Russell 2000 ($RUT) index has not performed as strongly as the blue chip indexes and this may be another sign that the rally cannot last much longer. Note how Friday’s highs were well below the highs of June 5, whereas these are roughly equivalent in the Dow and S&P. All of a sudden then, a previously bearish technical picture has become quite mixed with the bulls looking like they are gaining the upper hand. I would not rule out a run to the 200 DMA at 1113 in the near term, especially since that roughly coincides with the upper Bollinger band at 1117. Support is likely around the 50 DMA at 1085 and below that perhaps the 20 DMA near 1070. This latter number coincides with the most recent red candle and was Wednesday’s low. While this week certainly has the potential to take out these intermediate support levels, I have a sense that we may have to wait another week before they are broken.
 This week has the potential for big moves (hopefully down) as a number of major aspects will be in play. As if to mark it with an exclamation point, Monday’s Full Moon in Capricorn coincides with the Saturn-Uranus aspect. Saturn-Uranus aspects can coincide with significant market tops so we have to allow for the possibility for an up day here. Plus, the Sun will be just a little bit past its exact trine aspect with Jupiter at the start of trading. This is usually a positive influence although the upbeat mood often dissipates soon after exactitude. More negatively, however, Mercury is in aspect with Mars and Neptune here. Mercury-Mars aspects are usually bearish for the market although this one will be losing strength through the trading day. Overall, I would lean towards a negative day here, possibly a large one. Tuesday also has the potential for declines, although if Monday is already down, then an intraday reversal is perhaps more likely. The rest of the week is harder to call owing to the close proximity of Mars to Saturn. While this conjunction is exact on Saturday, July 31, there is a chance that this conjunction could produce down days at any time. Ironically, we can see some positive influences occur later in the week also, as the Moon opposes Venus on Thursday and Mercury moves into a minor but positive alignment with Jupiter and Pluto on Friday. But with Mars and Saturn about to come together so soon afterwards, I would be cautious around any upside expectations here. No doubt some up days will occur this week. In fact, it is conceivable that the week could be positive although that seems quite unlikely. The planets are sufficiently portentous this week that we need to consider the possibility of some kind of crash occurring in the near term. A crash would defined as a 10% or greater decline in a single day, or perhaps 15% over a few consecutive days. As I said last week, I don’t believe a crash is likely in the next week or two, but the chances of it have risen substantially from say, zero, through most of July, to perhaps 20%. Maybe I am intentionally downplaying its chances here in order to avoid disappointment. Also I don’t see much imminent upward thrust in the US Dollar that would accompany a crash scenario. In that sense, there seems to be something lacking in the current pattern. But what is particularly noteworthy is that there is so many aspects packed into a small time frame. This could either manifest in a sudden, massive explosion in the form of major world event that shock the markets, or it could mark a major high. The latter possibility presumes that we rise (!) into July 30 and then fall sharply afterwards. Needless to say, I don’t much like that scenario but it is something to ponder.
 Next week (Aug 2-6) actually looks more bearish with a large declines possible on Monday the 2nd or Friday the 6th. The keys here are Mars opposing Jupiter and squaring Pluto while Venus enters Virgo to join Saturn. Venus is fallen in Virgo so it suffers doubly from Saturn’s conjunction. Tuesday has a Sun-Rahu aspect that is likely to also generate greater fear and distrust. Friday features Mercury in aspect with Rahu while Venus is just two degrees from Saturn. Not a pretty picture to be sure. The following week (Aug 9-13) looks better at least at the beginning of the week. While some bounce is likely into mid-August, the second half of the month looks more bearish. With an interim bottom likely around Labor Day, some rise is likely going into the Jupiter-Uranus conjunction on September 18. This may be a garden variety bounce of up to 10%. Another crash window opens up after that as Saturn prepares to square Rahu on September 27. The most dangerous period extends from Sept 21 to about Oct 7. I would put the odds of a crash a little higher than they are for late July and early August — say about 30%. My guess is it will be this second major downdraft into early October that will force the Fed to unleash a second round of stimulus measures (QE 2). This will be conveniently released ahead of the midterm elections on Nov 2 in order for Obama and the Democrats to appear to be "doing something" on the economic front. A huge rally is likely in October which looks bigger than a standard dead cat bounce. Generally speaking, a more bullish scenario would have the S&P trade around 1040-1070 by the first week of August and then fall to 1000 by Labor Day. It could then rally back to 1050 by September 18 and then down hard into early October to 920. It would then rally sharply back to 1050-1100 by November before falling again. A more bearish scenario would be that the S&P falls below 1000 by early August, then slides to 920 by Labor Day. It could then rise to 975 by September 18 and then down hard into early October to 800-850. It would then rally to 1000 by November and fall again. I am leaning towards the more bearish scenario here but a lot will depend on what kind of mayhem the Mars-Saturn conjunction produces over the next week or so.
5-day outlook — bearish SPX 1060-1090
30-day outlook — bearish SPX 1000-1050
90-day outlook — bearish SPX 900-1000
 Stocks in Mumbai made new highs for the year on positive earnings news from Wipro and improved global prospects. The Sensex added 1% to close above the 18K for the first time in over two years at 18,130 while the Nifty finished at 5449. Alas, the torturous path higher continues. While I had allowed for some upside midweek on the Venus-Rahu aspect, I did not fully expect a higher close overall. I was correct in calling for early week declines but as has been the case recently, down days have been very muted so we only got fractional sell offs in the key indices. Tuesday’s entry of Mars into Virgo was the presumed correlate of this bearish atmosphere, even if it did disturb the dominance of the bullish Jupiter-Pluto aspect. Since the early week losses amounted to less than one percent, this opened the door for overall gains as the speculative nature of Venus was encouraged by Rahu into midweek. The absence of any late week declines was also somewhat disappointing although Friday’s session at least showed only minimal gains. Thus far, July has come under the benefic influence of Jupiter through its aspect with Pluto (exact 25 July) and the culmination of its direct motion cycle on 23 July. The optimism of Jupiter has managed to stave off any bear raids and has reduced them to fleeting moments of indecision. While I had foreseen price stability in July due to this Jupiter influence, its ability to crowd out negative aspects has been surprising. As a result, the market is making major new highs against a backdrop of some fairly serious planetary aspects. On the surface, this is a contradictory situation since the Saturn-Uranus opposition ought to have prevented new highs from occurring. However, the Indian markets have been the beneficiary of some excellent natal placements that have simultaneously downplayed the negative impact of Saturn, while boosting Jupiter’s capacity to raise prices. In any event, it seems likely that Jupiter’s time in the spotlight is about to conclude here. Jupiter (9 Pisces) began its retrograde cycle on Friday and its backward motion will move it back into late Aquarius. The effects of this reversal in its optimistic energy are potentially significant and so this could correspond with a major trend reversal. Another facet of Jupiter’s manifest energy was due to its aspect with Pluto. This will come exact on Sunday, 25 July and will slowly begin to dissipate thereafter. Since both of these distant planets move exceedingly slowly, this dissipation could be quite gradual. And yet, the near simultaneity of these two Jupiter developments is one reason to expect a significant change in market direction. The other main reason is that whereas Jupiter appears to be fading, Saturn seems poised to take centre stage once again. It will oppose Uranus this Monday (26 July) and then be joined by fellow malefic Mars on 31 July and then Venus on 8 August. Saturn will continue to play a role in shaping sentiment as it will oppose Jupiter on 16 August. It’s worth noting that the previous Jupiter-Saturn opposition occurred on 22 May and coincided with the major leg down. That’s not to say that the same will happen this time around, but this aspect increases the likelihood of more bearishness at that time. Bearishness is also likely to surround the Saturn square of Pluto on 20 August. A solidly bullish Jupiter-Uranus conjunction is slated for 18 September so the time leading up to that may be positive but then Saturn is again prominent in late September through its square aspect with Rahu on 27 September.
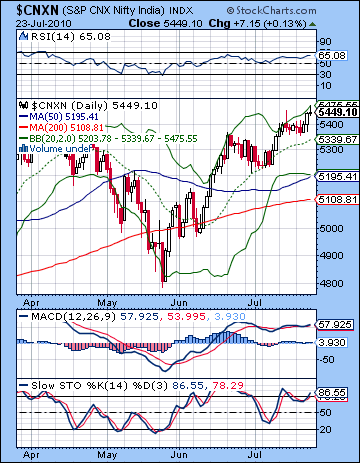
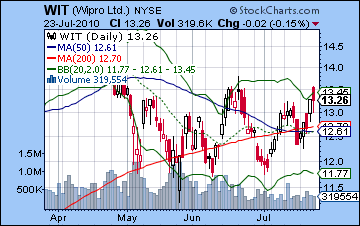
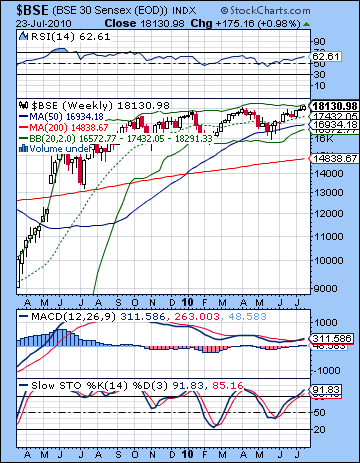 The bulls received a boost from the new highs last week as the technical picture remained in their favour. The rising upward channel dating back to 2009 is still intact by virtue of a series of higher highs and higher lows. Momentum is still with the bulls as the key moving averages continue to rise and are stacked appropriately. But scratch the surface and you can see that problems are lurking in the bullish case. We got new highs last week but volume was very low — just 16k on Thursday with 13k average on the days leading up to that. This does not suggest much conviction and therefore does not support the notion that the market may be preparing for a new leg higher. Daily MACD is also looking suspect now as higher highs have not corresponded with higher highs in the MACD. They are clearly showing a bearish divergence with respect both to the previous June and April highs. It is much the same story in the RSI (65) as there is a negative divergence with respect to the April high (70). Stochastics (86) are again in the overbought area but form a lower low compared with the high formed on 13 July. This is a negative divergence that is likely to be resolved only through lower prices. Friday’s session produce an inverted hammer candlestick, or perhaps a gravestone doji, but both have a higher probability of marking a top in the trend. Friday’s close was also at the upper end of the Bollinger band suggesting a move down may be in the offing. Stochastics (91) on the weekly Sensex chart are well into the overbought zone and also suggests that a retracement will not be far away. Wipro’s NYSE chart (WIT) reveals the familiar death cross of the 50 and 200 DMA. But despite favourable earnings news, it could not reach above the previous high of 21 June. This is not a bullish chart. Looking again at the Nifty chart, we can discern that current prices lie within a rising wedge that culminates around 5540 in early August. This wedge has its origins in the bottom of the May correction. Of course, that doesn’t mean it will get to 5540 but rather that the two lines of support and resistance merge at that time around that level. Support is very close at hand — around 5400. A violation of this level could lead to a waterfall effect that takes prices down quickly and retest the May lows below 5000. Some intermediate support might be first offered by the 50 DMA around 5200 which is also the bottom of the Bollinger band. Below that, a deeper correction would test the 200 DMA at 5100. Overall, the technical picture looks ripe for a decline very soon.
This week will see a series of potentially powerful aspects that could take markets down significantly. The exact Saturn-Uranus opposition on Monday takes place on the same day as the Full Moon. That in itself is fairly significant that we could see a changing of the celestial guard here. We will also see a close Mercury-Mars-Neptune alignment on Monday so that is likely going to tilt things in favour of the bears. What’s also interesting is that the RBI is likely going to hike interest rates on Tuesday. This is perhaps a perfect expression of the new dominance of Saturn, the planet of restraint and caution. The RBI feels it has no choice but to choke off inflation at the source even if the government may find this difficult to sell politically. It is possible there could be some surprises in this rate announcement, including the possibility of a 50 basis point hike. This would likely spook markets and spark a selloff. Given the fairly bearish planets here, this type of scenario is worthy of consideration. While I have overestimated the downside impacts of aspects lately, there is some reason to think that the downside could be fairly large here, perhaps on the order 3-5% in two days. Let’s see how much Saturn has replaced Jupiter in the pantheon of planets in the sky this week. We are likely to see at least one up day between Wednesday and Friday. The Moon aspects Venus Thursday and Friday morning, so those might produce some fairly bullish results. Overall, however, the outlook is quite negative. There is a chance that we will trade around 5200 at some point with a close somewhere above that level, perhaps around 5300-5350 although that is very much a guess.
 Next week (Aug 2-6) is likely to continue the bear fest as Venus enters Virgo by Monday. Venus is debilitated in Virgo and this handicap, coupled with its conjunction with Saturn is likely to greatly weaken spending impulses and speculative interest. We should see some rebound in the middle of the week. The following week (Aug 9-13) may begin bullish, but the end of the week is likely to erase some if not all of that week’s gains. Some sideways movement is possible for the second half of August although I feel there will be a bearish bias here as Venus will be in close proximity to Mars for much of this time. After a possible interim low in the first week of September, gains are more likely going into mid-September and the Jupiter-Uranus conjunction. These gains are likely to be short lived as another leg down is likely at the end of September and into early October. A possible significant low could be made October 7 and the Mercury-Saturn conjunction. A strong rally is likely soon after which will last through much of October and into November. So a more bullish scenario would see the Nifty fall to 5200 by early August and then temporarily bottom out around 5000 by early September. After a brief rise to 5200 in mid-September, it would fall again to 4500-4800 by early October. The October rally would likely take it back above 5000 by November. A more bearish scenario would look like this: 5000 by early August, then 4500-4700 by early September. A rise to 4800-4900 by mid-September and then down hard to 4000 or below by early October. November would see an interim high around 4500-5000. I tend to favour the bearish scenario at the moment, although much will depend on what kind of drop we see from the Mars-Saturn mayhem in the coming days.
5-day outlook — bearish NIFTY 5200-5300
30-day outlook — bearish NIFTY 5000-5200
90-day outlook — bearish NIFTY 4200-4800
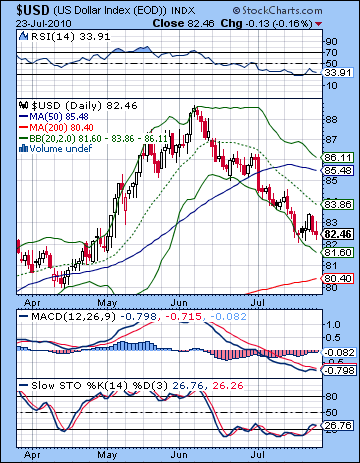 After six straight losing weeks, the US Dollar finally found some footing last week and closed unchanged near the 82.5 level. I had low expectations here as the stars did not favour much upside, although I thought we could see something later in the week. Unfortunately, we saw more selling then as the Dollar failed to gain traction. Part of the explanation lay in the improved economic outlook for the US as seen through the positive earnings reports that lifted stocks through the week. In this respect, the Dollar is currently in a flexible relationship with other asset classes. While it gained during the initial May equities selloff, continued weakness in the US economy has translated in more investors dumping the Dollar as a vote of no confidence. With that relationship in flux, it is unclear just where the Dollar will line up with respect to stocks going forward. If the correction enters its deeper second phase as I expect, one would anticipate the Dollar to resume its safe haven status and its value should rise. That said, a renewed sell off in equities may well see more investors selling the Dollar as they search for safer instruments. It is a situation that demands close attention. The technical situation is improving here as several indicators appear to be close to a bottom. Daily MACD is on the verge of turning higher and crossing over while RSI (34) is showing a nice, if modest positive divergence with respect to last week’s low. Stochastics (26) are gamely trying to stay above the 20 line and could be preparing for a major move higher. The 20 DMA is falling and coincides with resistance in the downward sloping price channel around 84. A break above this level would likely initiate a larger rise.
This week looks mixed for the Dollar. While the Saturn-Uranus aspect increases the likelihood of a pullback in stocks, it is unclear if the Dollar can benefit from this development. Certainly, the early week looks primed for a Dollar rally as the Mercury-Mars ought to create an environment where investors prefer security. But there is a curious absence of aspects in the USDX horoscope that would support such as development. Transiting Venus is high in the chart in the 10th house which is usually favourable, but I would like to see more bullish evidence. The late week period looks somewhat weaker as Mercury will align with Jupiter and Pluto on Friday. Overall, I would lean towards a positive weekly outcome although perhaps not by much. Now that Jupiter is retrograding, it will gradually provide a boost to the natal Saturn and then the natal Sun. This relationship will likely strengthen as we move into the second half of August and early September.
The Euro is still looking strong here as it flirted with 1.30 several times last week before closing at 1.29. I thought we might see a little more downside given the entry of Mars into the 12th house of the Euro horoscope. The Euro is pushing up against some formidable resistance here and its trading close to the top of its Bollinger band. Prices remain above the 20 DMA and the 50 DMA is now rising. Indicators are showing signs of decay however and the Stochastics look increasingly overbought. This week looks difficult for the Euro as Mars (5 Virgo) bears down on the ascendant (5 Virgo) in the natal chart by the end of the week. Combined with Saturn, this is an explosive combination that could cause a lot of problems. Earlier in the week, Mercury will drift past the 12th house cusp and that is also unlikely to help the Euro. Overall, a down week seems likely. A gradual weakening is likely over the next 4-6 weeks and should see the Euro retest its recent lows around 1.19. The Rupee was similarly unchanged on the week and closed around 47. Although the RBI rate hike seems likely to boost its value in the short term, a weakening is more likely through August.
Dollar
5-day outlook — neutral-bullish
30-day outlook — bullish
90-day outlook — bullish
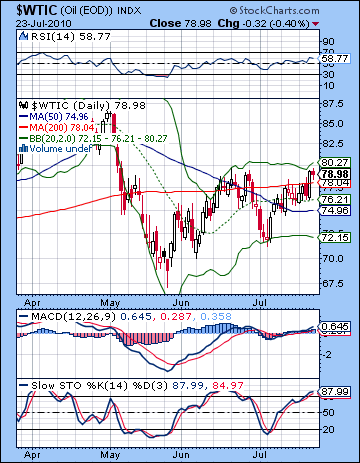 As growth prospects improved on better than expected corporate earnings, crude oil rose by 4% on the week closing near $79. This bullish outcome was unsurprising given the positive aspects in water signs that I have outlined last week. While I had been uncertain how much upside they could provide, it seemed likely that the Moon’s transit of watery Scorpio would serve as a catalyst for the other planets — Sun and Mercury in Cancer and Jupiter in Pisces. The big rise came on Thursday when the Moon was in the final degrees of Scorpio and formed a trine aspect with Mercury. Significantly, this Moon-Mercury duo also were hitting a sweet spot in the Futures chart. The technical situation looks overextended here as prices were once again halted around the June highs. This is near the 200 DMA and also at the upper end of the Bollinger band, so Friday’s down day may be the beginning of a move lower. MACD is in a small bullish crossover while RSI (58) is bullish but may be encountering resistance around the 60 level. Stochastics (87) are well into the overbought area indicating that a reversal down could be in the cards. Support in the past two weeks has occurred near the 20 DMA around $76 but this is unlikely to withstand a more major decline that the Stochastics are suggesting. The lower Bollinger band is around $72 so that may be a better intermediate term target in the event of the pullback. This ramshackled head and shoulders pattern seems to be on the verge of breaking down.. If the $70 neckline is to be trusted, then we can project an eventual price target of $52 sometime over the next few months.
This week looks quite bearish for crude. Mercury has left Cancer and entered Leo so that is one less planet in a water sign. After Monday, the Sun will slowly move away from Jupiter’s exact aspect so that is another gradual diminution of strength. The Saturn-Uranus oppostion sets up quite close to Rahu in the Futures chart so this may increase stress on prices. Transiting Mars (4 Virgo) will aspect Ketu (4 Sagittarius) on Monday and perhaps into Tuesday so this is likely to correspond with significant selling pressure. The density of aspects this week makes the intraweek dynamic somewhat harder to call. Friday is typical in this respect: the Moon conjoins Jupiter in Pisces while Mercury will enter into an alignment with Jupiter and Pluto. In normal circumstances, this would be a very bullish combination. However, with Mars less than one degree from its conjunction with Saturn here, all bets are off, especially on the upside. Friday therefore has a better chance at a gain, but it is not a clear picture. Next week also looks quite difficult although some recovery is likely at the end of the week. Prices may firm after that but the second half of August looks more difficult. A significant bottom may be formed at the end of September.
5-day outlook — bearish
30-day outlook — bearish
90-day outlook — bearish
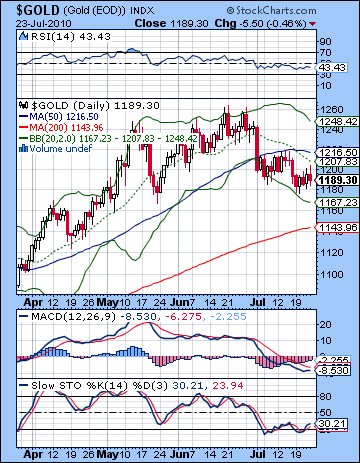 Despite improved economic prospects, gold failed to participate in the equities recovery last week as prices stagnated around $1190. This was all the more uninspiring given the ongoing weakness of the US Dollar. Clearly, gold is trouble here as the whispers about deflation grow louder. This mildly bearish outcome was not out of line with expectations although I thought we might see a little more upside on the Sun-Jupiter aspect late in the week. The technical picture still looks pretty grim. Since falling below support of the rising trend line at the end of June, gold has essentially traded flat. The trend is down here as the 20 DMA is now falling and last week we saw a negative crossover in with the 50 DMA. Daily MACD is still in a negative crossover and RSI (43) appears to be languishing in bearish territory. Stochastics are trying to break out decisively from the oversold area but appear to be stuck down in the depths. Since prices are in the lower half of the Bollinger band, there is a small case to be made for higher prices in the very near term, but given the current bearish climate, prices may halt any advance at the 20 DMA ($1207) and turn back down. The 50 DMA has also been acting as fairly significant resistance ($1216) so that may also be considered as a possible target in the event of any rally attempts. I have my doubts if gold can reach that high in the coming days, however. The weekly chart looks that much worse as there very pronounced divergences in the MACD and RSI. With immediate support levels broken, gold seemed ripe for a steeper tumble. The 200 DMA ($1143) may offer some support, especially since it corresponds to the approximate neckline of the inverted head and shoulders that prompted the recent breakout move in April. Below that, $1000 may be considered as the support of last resort.
This should be a more lively week for gold. While I am very bearish here, I would not rule out the odd up day or two. Monday and Tuesday are somewhat more promising in this respect as transiting Mercury (4 Leo) will aspect the natal ascendant (5 Sagittarius) in the ETF chart. That said, the whole pattern with Mars closing in on Saturn here makes this otherwise positive setup much less reliable than it would otherwise be. Monday’s other ace in the hole for gold is that the Sun will be in close aspect with Jupiter. While this aspect will be exact before the start of trading, some upside follow through is still possible. The other factor that is working in gold’s favour this week is that Venus is still in Leo. With Mercury now also in Leo, the sign most representative of gold, this could provide some support. Next week looks more challenging, however, as Venus will enter Virgo, the sign of its debilitation. This could coincide with a larger move down through August. Gold appears to have begun a larger retracement back down towards $1000. This should last into September and then another significant rally may begin in October.
5-day outlook — bearish-neutral
30-day outlook — bearish
90-day outlook — bearish