

 (28 December 2025) Stocks pushed higher last week as favorable holiday seasonality combined with strong GDP data to fuel gains in financials and industrials. I had a fairly neutral weekly bias in my given the mix of bearish and bullish influences. The aftermath of both the Mars-Neptune square and the progressed Mercury-Saturn alignment raised the odds of some modest downside although the bullish effect of the upcoming Sun-Mars-Venus conjunction was a possible offsetting factor.
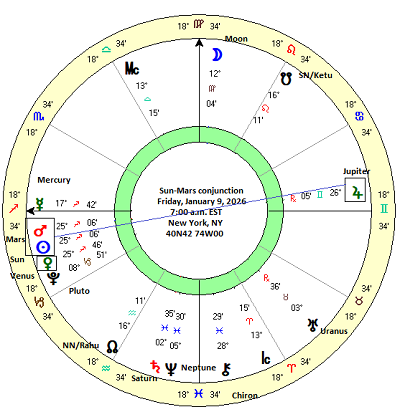
In this week’s post I thought we could take a second look at this rare triple conjunction of the Sun, Mars and Venus which occurs on January 9, 2026. As we showed last week, previous conjunctions of these planets were quite bullish. This includes both the more frequent Sun-Mars conjunction (n=59) and the Sun-Mars-Venus triple conjunction (n=15). Moreover, both conjunctions had statistically significant bullish outcomes across a variety of intervals both before and after the day of the exact conjunction (“0d”).
I have replicated the cumulative trend chart below but this time including the current calendar dates to match the 5-day intervals of previous conjunctions. I have also included the progress of the current price trend on the Dow Jones Industrials with the red “actual” line. So far this is broadly tracking the historical averages and medians fairly closely. All three are well above the benchmark expected line which was calculated from a 5.4% average annual return for the years 1897-2023.
And to further illustrate the possible effects of this upcoming triple conjunction, I have annotated a price chart of the DJIA see below. Actually, I have included visualizations of two separate alignments in this chart. The slightly declining red/pink channel/bull flag on the left shows the average price change of the Mars-Neptune 270-degree alignment. The rising green channel on the right shows the possible size and contours of the impact of the Sun-Mars-Venus conjunction across the 60-day period of our study.
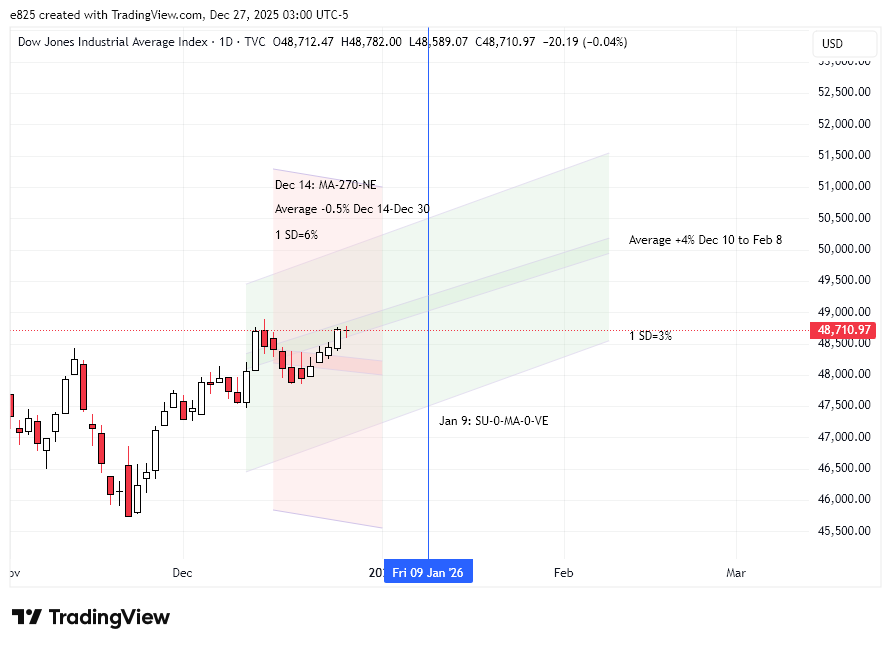
The narrow, darker channel in the middle of both parallel color blocks approximates the average move based on our backtest. The full vertical size of possible price ranges depicts one standard deviation (SD) of past alignments. Assuming an even data distribution, one standard deviation accounts for 68% of all observations.
For the bearish red/pink channel representing MA-270-NE, the average decline was quite modest at just 0.5% during the 12- to 15-day period after the alignment on Dec 14 (i.e. to about Dec 29). However, the huge standard deviation (= 6%) highlights how unreliable it is as a predictor of future price movements. The DJIA did fall for a couple of sessions after Dec 14 but has since rebounded. Given the wide range of possible outcomes, this visual depiction underscores the limited predictive power of the MA-270-NE alignment. And since we will exit the active period of this alignment this week, it would seem that any downside risk is quickly diminishing.
The bullish triple conjunction in green seems more useful for making predictions. With a standard deviation close to 3% for most intervals, this channel is narrower and thus argues for higher prices to come, although still within a fairly wide range. The green channel looks more reliable since the results of these two conjunctions were more statistically significant and had stronger price effects that the Mars-Neptune pairing.
The Jupiter opposition to the Sun-Mars-Venus triple conjunction
Another interesting wrinkle to this triple conjunction is that it occurs while in a near-exact opposition with bullish Jupiter. This four-planet alignment is even rarer and further increases the odds for gains in January. Of course, while Jupiter alignments are considered bullish, we should always be careful to verify our assumptions by examining historical precedents with empirical data. Actually, some astrologers might consider the opposition with Jupiter to be more problematic due to the widespread belief in Western astrology that opposition aspects are less productive than the conjunction (0 degrees), the sextile (60 degrees) and the trine (120 degrees). Let’s see what the historical record has to say.
The summary statistics table below shows the effects of the Jupiter opposition to the Sun-Mars conjunction. Venus was omitted from consideration here in order to increase the sample size into something more workable. As it was, we only found 10 previous instances of the Sun-Mars conjunction in opposition to Jupiter. The results provide empirical support for the notion that the Jupiter opposition to Sun-0-Mars is indeed bullish. Most of the intervals tested had substantially larger effects than the default expected result based on the 5.4% long term average annual return from 1897-2023. The results were also more bullish than the Sun-Mars conjunction alone.
Interestingly, the results are roughly comparable to the Sun-Mars-Venus conjunction in terms of bullishness. The first column (“-30d 30d”) posted a 3.97% average return and a 4.04% median return — well above the 0.89% expected return for any random 60-day time interval. However, we should note a massive standard deviation here of 8.64%. This reflects a very large variation in results across the 10 cases. Perhaps not surprisingly, that large standard deviation is the reason why the bullish result was not statistically significant as the p-value was well above the 0.05 threshold (p = 0.288).
If we look more closely, we can see a pattern whereby the significant results and large effect sizes are concentrated in the period leading up to the exact SU-0-MA-180-JU alignment. The intervals that follow the alignment such as the third column (“0d 30d”) that shows the effect 30 days afterwards isn’t much different from the expected value. This suggests that most of the bullish influence of this alignment is more likely to occur in the approach to the alignment. For the current situation, that means that gains are more likely to be concentrated on or before January 9, with diminishing probability of gains thereafter.
This is also seen in the cumulative trend chart below. The average and median lines experience the lion’s share of their rise up to the day of the conjunction on January 9. There is no guarantee that history will repeat this time around but we should be aware of the gradual weakening of this bullish Jupiter effect once the exact alignment has passed.
As noted above, we excluded Venus from consideration in order to increase the sample size while approximating the effects of the current alignment. If we include Venus into the alignment, the sample size drops to just 2: June 10, 1936 and April 2, 1981. Those are the only previous occurrences that replicate the January triple conjunction of Sun-Mars-Venus which is in opposition to Jupiter. Very rare indeed. While a statistical analysis of just 2 cases is not very helpful , we do note that stocks were generally bullish both before and after these dates.
The 1936 alignment saw stocks rise 9% during the 60-day interval (“-30d 30d”) of which about 4 % occurred before the alignment and 5% occurred after. The 1981 alignment saw a more modest rise of 3% during the 60-day interval with a 4.5% rise taking place before the alignment and a 1% decline occurring afterwards.
The bottom line here is that the addition of the Jupiter opposition to the triple conjunction only serves to increase the bullish potential in early January. Whether or not stocks will peak around January 9 remains to be seen. The previous Sun-Mars-Venus conjunctions showed no such peaking as the up trend generally continued for the 30 day interval that followed the conjunction.
Implications for this week
The stage would seem to be set for further gains. This doesn’t necessarily preclude some downside this week, however, as we are on the tail-end of the tested period of the Mars-Neptune and Mercury-Saturn alignments. As weak as those bearish alignments are, it would not be shocking to see some downside in the coming days.
But since the bullish effect of the Sun-Mars-Venus conjunction is so much stronger, it seems more likely that dips will continue to be bought and we will finish higher yet again this week, even with Thursday’s New Year’s Day holiday closing. And even if we don’t, the following week offers even better odds for upside.
Disclaimer: Not intended as investment advice. For educational purposes only.
If you would like to receive these weekly posts in an email format, please subscribe to my free Empirical Astrology newsletter on Substack.
