

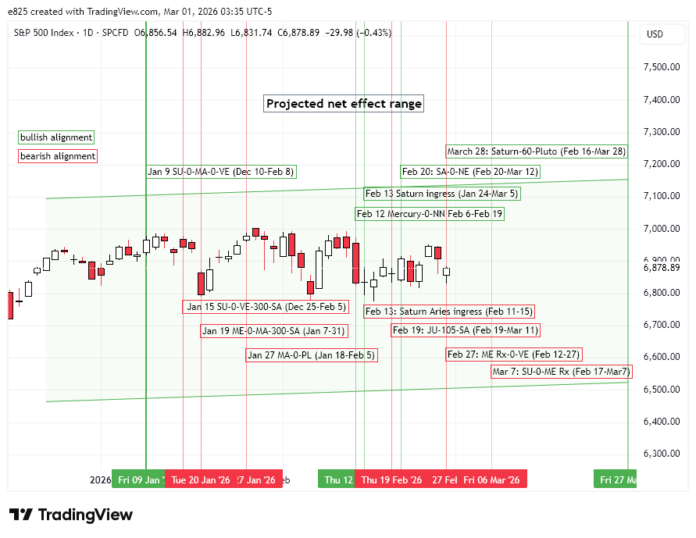
 (1 March 2026) US stocks finished modestly lower last week on higher-than-expected wholesale inflation data and renewed worries over the negative economic impact of AI. Not even the Nvidia earnings beat was enough to keep the market up. Despite the dip, most of the indexes remain very close to their all-time highs.
The decline was in keeping with expectations given the combined bearish effects of 1) Mercury retrograde on Feb 26, 2) Mercury Rx conjunct Venus on Feb 28 and 3) the Jupiter-105-Saturn alignment from Feb 19. Our backtesting of these influences suggested that all three could be bearish in the current period, even against a background of medium term bullish influences such as the Saturn-Neptune conjunction, the Saturn ingress into Aries and the approach of the Saturn-Pluto sextile on March 28.
Updating our cumulative trend charts, we can see that further downside is possible. Both the Mercury Rx-Venus conjunction and the Jupiter-105-Saturn alignment charts are tracking well above the long term averages and medians for those alignments. The current (red line) Mercury Rx-Venus conjunction (shown below) is still well above the benchmark and has yet to intersect with the blue lines. Of course, they don’t have to meet at all since every alignment is unique and does not have to adhere to long-term averages. This is particularly true in datasets with a wide distribution and large standard deviation (SD = 4%) as is the case here…
To read the rest of this post, please visit my Empirical Astrology Substack
