

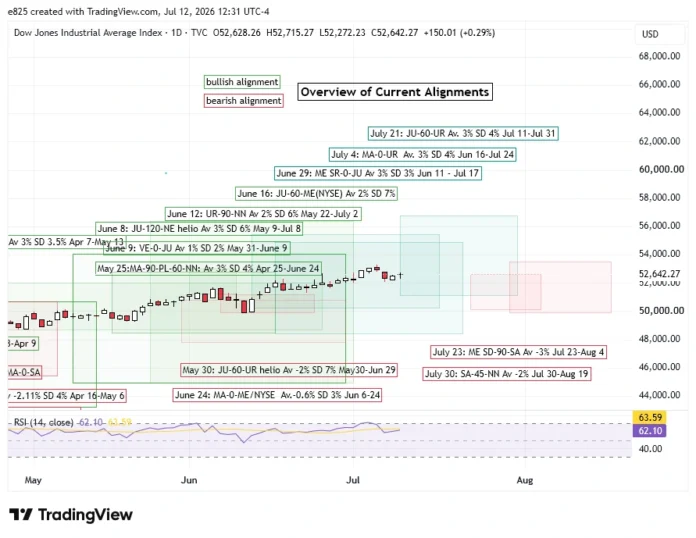
 (12 July 2026) Stocks were mixed last week as chip makers and big tech rebounded from their recent sell-off while the broader market finished modestly lower. Despite the collapse of the Iran ceasefire deal, the S&P 500 is now less than 1% from its all-time high of 7620 set in early June.
While markets have been choppy lately, they are still mostly bullish as we approach the July 21 Jupiter-Uranus-Neptune-Pluto alignment. This rare alignment has all the appearances of being bullish, although its rarity means there is very little data which supports its positive market influence. There have only been two analogous alignments over the past 130 years with one being bearish and one bullish, although the bearish outcome also had an additional simultaneous Saturn aspect which our current transit set up thankfully lacks.
One element of this four-planet Jupiter-centered alignment is the Jupiter-Uranus sextile marked by its 60-degree angular separation. Our backtest study demonstrated its bullish track record, although somewhat surprisingly its most bullish period occurred after the exact sextile aspect. As the updated cumulative chart below shows, the period 10 days prior to the sextile was actually choppy in our backtest, implying that this influence may become more bullish after July 10, all other things being equal. Of course, it is only one factor among many and does not mean that stocks must rise over the next week. Rather, its bullish influence should be weighed against other current alignments in order to arrive at a more balanced overall picture.
But other alignments do look bullish. The Mars-Uranus conjunction of July 4 is a modestly bullish influence during its post-alignment period. The updated cumulative chart below shows how the current Mars-Uranus conjunction is tracking the historical mean and median quite closely.
The aftermath of the June 29 Mercury retrograde station while conjunct Jupiter is also largely following its previous historical pattern. The updated cumulative chart below illustrates how the mostly bullish impact of this alignment is playing out in its current form (red line). Further gains in the days ahead would be the most likely outcome, although this combination is only modestly bullish during its post-alignment period. Therefore, more market choppiness would not be unexpected…
To read the rest of this post, please visit my Empirical Astrology Substack
