

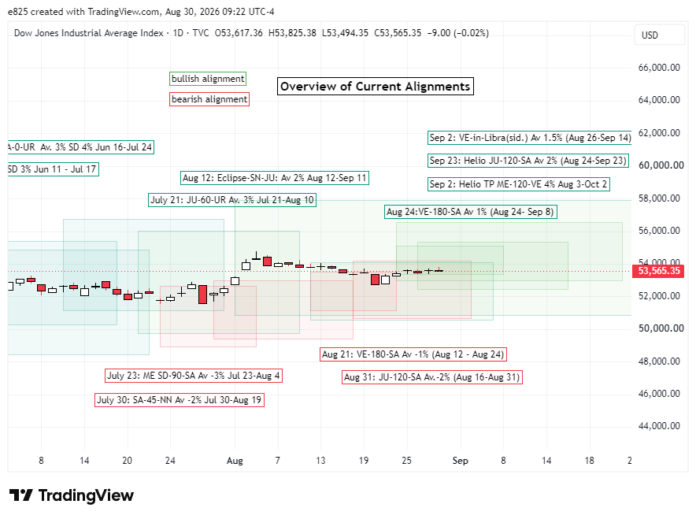
 (30 August 2026) US stocks were mixed last week as the NASDAQ and S&P 500 got a boost from strong Nvidia earnings. The broader markets finished modestly lower, however, as the inflation and interest rate outlook remained uncertain following Fed Chair Warsh’s hawkish remarks at Jackson Hole.
This mixed outcome was not surprising given the range of alignments in play. Although I had noted some ongoing favourable influences, the presence of several potentially negative alignments raised doubts about the final weekly outcome. The aftermath of the Aug 12 solar eclipse was passing through a less positive period around the time of the Aug 27 lunar eclipse. This price dip is seen in the updated cumulative trend chart below and bottoms out around 12 to 18 days after the initial Jupiter-centered solar eclipse. Going forward, this post-lunar eclipse period looks more bullish, although this is not a robust or decisive influence.
Another potentially bearish influence last week was the Venus-Saturn opposition in sidereal Virgo. Both the mean and median of this limited sample (n=10) printed an interim bottom 3 days after the exact Venus-Saturn opposition on Aug 21. For the current alignment, this occurred last Monday, Aug 24. As it happened, stocks formed a low on the day of the opposition on Aug 21 and have since rebounded somewhat. While further downside is always possible, the post-alignment bias of this aspect now looks more bullish than bearish.
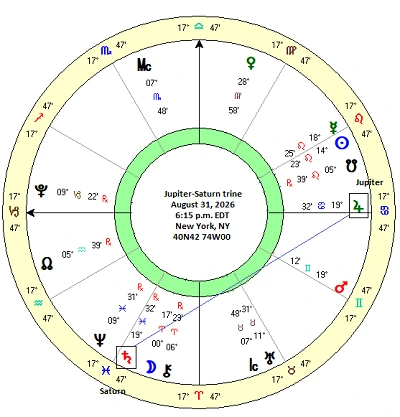
The Jupiter-Saturn trine aspect (exact Monday, Aug 31) is another potentially bearish alignment. Our backtest of previous alignments which shared characteristics of the current alignment (Jupiter direct, Saturn retrograde, and 120 degrees only; n=9) indicated downside risk during the pre-alignment phase. The updated cumulative chart below shows how the market has generally outperformed their historical averages for this alignment. However, we should note that they have experienced a modest decline over the past two weeks in keeping with the mean and median downtrends. Further downside this week is certainly possible, but the probabilities will shift from bearish to bullish at some point this week.
At the same time, the bullish influences remain in place. The heliocentric tertiary progressed alignment of Mercury and Venus is a favourable influence until the second half of September based on our historical backtest. The price effects of the current alignment have cooled off of late as the trend (red line) is now approaching the long term mean and median. While there is nothing in this chart that precludes some downside in the short term, the rising mean and median suggest that further upside is more likely than not in the coming weeks.
To read the rest of this post, please visit my Empirical Astrology Substack
Disclaimer: Not intended as investment advice. For educational purposes only.
