

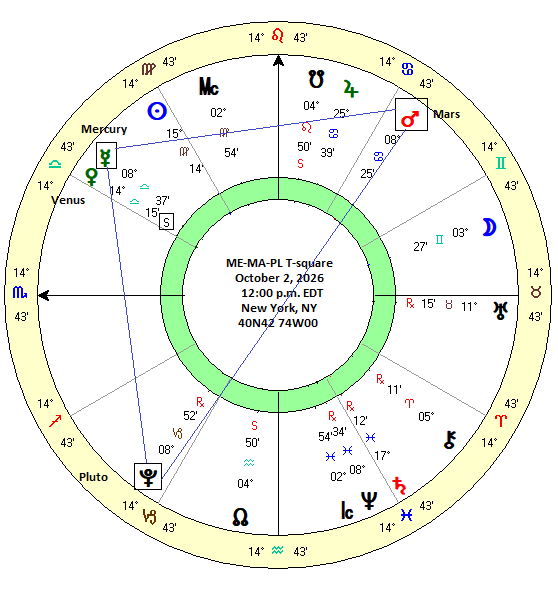
 (20 Sep 2026) Stocks ended mixed last week after the Fed rate hike and the expansion of the conflict in the Middle East. While stocks initially sold off after the widely-anticipated rate hike, they staged a partial late week recovery. The Nasdaq posted a winning week while the S&P 500 was flat and the broader market were generally lower.
I thought we might have seen a bit more upside, if only due to mean reversion in several of the bullish alignments we are monitoring. As we get closer to the Venus retrograde station on October 3, we may well ask if this recent run of market weakness has further to go since the retrograde station can often serve as a trend reversal pivot. I don’t have a strong opinion either way on that ‘bearish before/bullish after’ Oct 3 scenario although the longer stocks track sideways or lower in September, the more plausible it becomes.
Certainly, the past three Venus retrograde cycles have coincided with pullbacks in Jan 2022, Aug 2023 and Mar 2025. But each of those periods of weakness featured other alignments which were more clearly bearish. Jan 2022 had a Saturn-Uranus square and a Mercury retrograde station that conjoined Saturn. In Aug 2023, Venus, along with Mercury and Mars, was opposite Saturn. In March 2025, Saturn was conjunct the North Lunar Node while Mercury also turned retrograde and both Mercury and Venus ended up conjunct Saturn and the North Node in early April near the interim low.
It is therefore important to recognize that all three of the last Venus retrograde cycles featured a Saturn alignment. This time around the involvement with Saturn seems less prominent and hence less bearish, although its 135-degree alignment with Jupiter on Oct 31 warrants further examination. Hopefully I can take a look at it next week. Mercury will also turn retrograde Oct 24 and thus will produce a double retrograde situation which may be an additional burden on sentiment, although that would still likely require a Saturnian catalyst to manifest its bearishness.
One problem with the bearish Venus retrograde thesis is that across a large enough sample, its effects are very small — typically less than a -1% move — and none reached statistical significance in our study. The updated cumulative trend chart below shows how far below the current pre-alignment (red line) is from the historical norms for Venus retrograde. However, this is partially a statistical artifact of a random starting point 30 days before the Oct 3 retrograde station. It also reflects the fact that the SPX has fallen sharply between Sep 3 and Sep 18. If anything, this chart suggests some bullish mean reversion back up to the mean and median is more likely than not…
To read the rest of this post, please visit my Empirical Astrology Substack
Disclaimer: Not intended as investment advice. For educational purposes only.
