

 (23 August 2026) Stocks fell across the board last week as ongoing Iran tensions pressured bond yields as oil prices stayed above the key $80 level. Not even Wednesday’s announcement of the Treasury Department’s bond buy-back program was enough to restore market confidence as yields resumed their ascent on Thursday and Friday.
The sell-off coincided with two bearish alignments: the Venus-Saturn opposition in sidereal Virgo on Aug 21 and the approach of the Jupiter-Saturn trine on Aug 31. Previously, we had noted that the Venus-Saturn opposition was only slightly bearish in the days leading up to its exact 180-degree alignment. However, this bearish effect was magnified whenever Venus was transiting sidereal Virgo, its sign of debilitation. This produced sizeable declines of -1% to -2% in the two weeks leading up to the opposition, although the small sample size (n=10) prevented the result from reaching statistical significance.
The updated cumulative trend chart below shows how the price trajectory of the current opposition is now heading lower after an initial bullish phase. While it remains well above the mean and median, it may not necessarily touch those lines in its current iteration since the average low point is typically reached 3 days after the opposition. This is equivalent to this Monday, August 24. While further declines are possible after this date, the probability of a post-opposition rebound start to increase after this Aug 24 (“3d”) mark.
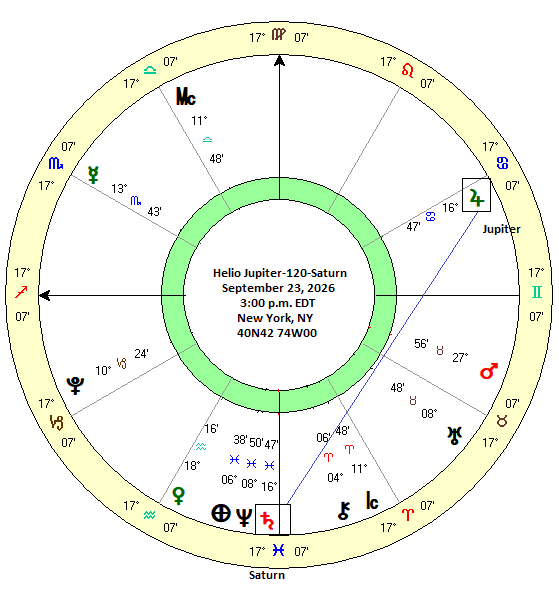
Last week’s decline would also seem to confirm the approaching bearish impact of the Jupiter-Saturn 120-degree trine alignment on Aug 31. This is another alignment that is only slightly bearish when all the aspects are analyzed in the aggregate. However, once we break it down into alignments which more closely replicate the conditions of the current alignment, its bearish effects intensify. Specifically the August 31 alignment will occur when: 1) Jupiter is in direct motion, 2) Saturn is retrograde and 3) the trine alignment will be 120 degrees — and not 240 degrees by counterclockwise reckoning. This subset of Jupiter-Saturn trines are usually more bearish in the days leading up to the exact alignment as the updated cumulative trend chart below shows.
So far, this aspect is tracking above its long term average. Nonetheless, after last week’s decline, it may follow its previous pattern and fall further as we approach its “0d” mark on Aug 31. At the same time, this aspect did not reach statistical significance for any of the tested intervals, although the mean decline was about -2% to -3% for the 15-day period leading up to the alignment. While the mean may have posted a larger decline for the same look back period, the test sample only consisted of 9 cases. On one hand, the small sample size limits its predictive power given the higher p-values. However, the same sample size also better replicates the current alignment by matching its specific conditions. Whatever predictive power is loses through its small sample size, it may recoup somewhat by being a closer analogy with previous alignments and thus matching its specific conditions such as aspect angle, planetary direction and so on.
To read the rest of this post, please visit my Empirical Astrology Substack
Disclaimer: Not intended as investment advice. For educational purposes only.
