

 (20 July 2025) Stocks edged higher last week on improving consumer sentiment and strong corporate earnings. The new all-time highs suggests the market is anticipating a positive resolution to Trump’s latest salvo in the ongoing tariff negotiations. Of course, failure to make a deal with the EU would upset those expectations. For now, however, investors are assuming that Trump will not risk a stock meltdown and may be more willing to reach a balanced agreement.
Last week’s gains didn’t come as a huge surprise given the mixed evidence associated with the heliocentric Venus-Saturn conjunction. But with Mercury turning retrograde on Friday, one wonders if some kind of pullback is now more likely.
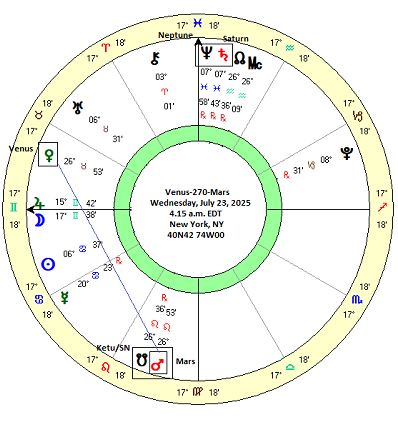
This week upcoming features a square alignment between Venus and Mars. The 270-degree Venus-Mars square occurs early in Wednesday. On the face of it, any alignment involving Mars carries a certain amount of downside risk since Mars is considered a natural malefic. Its alignments with Venus are believed to reflect unsettled conditions as the harmony of Venus is upset by the overly assertive nature of Mars. But what does the evidence actually say about this pairing?
Venus-270-Mars
To better understand the possible market impact of this aspect, I looked at the last 33 Venus-Mars squares over a period of 2000-2024. I included both the 90 degree and 270 degree alignments in my sample. While Vedic astrology only recognizes the forward 90 degree square of Mars, I wanted to test the effects of both squares. I took the closing prices of the S&P 500 at various 2-day intervals before and after the exact square alignment. Then I compared prices at different intervals to see if there was any pattern before or after the square.
While I have noticed that Mars aspects can often create problems for markets, my hypothesis was that this alignment would not be too bearish. I also thought the largest effect would be before the exact alignment with more bullish results occurring once the square was separating.
Results
The table below shows that there is very little effect from the Venus-Mars square. The left-hand column (“-10d 10d”) covers the longest 20-day time window before and after the alignment. Its average (0.55%) and median (0.51%) are very close to the expected value of 0.40% for any 20-day time period based on an average annual return to 7.2% for 2000-2024. In other words, this results suggests there is no effect across the whole period. When broken down into shorter 10-day intervals, there is no real difference. The average and median are mildly positive as chance would suggest.
If we shorten the time interval to 16-days (“-8d 8d”), we see a slightly negative result for both the average (-0.20) and the median (-0.26%). While this offers some support to the bearish thesis, there is no bearish confirmation in either the 8 days that precede the alignment or 8 days that follow it. The 12-day window (“-6d 6d”) and 8-day window(“-4d 4d”) also are not particularly negative. The medians are actually closer to the expected value than the average. As a general rule with widely distributed data as we have here (St Dev >2%), medians are a better way to estimate the typical outcome of any given case. The only bearish result was the 2-day interval before the exact square (“-2d 0d”) in which the average (-0.38%) and median (-0.21%) were negative with only 36% of cases producing a positive outcome.
Venus-270-Mars only
Given the relatively fast speeds of both Venus and Mars, it isn’t shocking to learn that their most negative interval is a very short 2-day period that precedes the exact square. This limited bearish result was replicated when the sample was divided into separate batches of 90 degree squares and 270 degree squares. With the 270-degree square due this week upcoming, it’s worth taking a closer look at the results of this alignment. Even if the sample is tiny –just 15 cases — it is noteworthy that the 12-day window (“-6d 6d”) produced a negative average (-0.56%) and negative median (-0.60%). The 8-day window (“-4d 4d”) also saw a negative average (-0.43%) and median (-0.09%). The shorter intervals around the time of the exact alignment was more neutral, however.
Conclusions
Overall, there is some limited evidence here for the bearish interpretation of the Venus-Mars square. However, it is very weak and should not bias our judgment about what might happen this week. While it is not especially bearish, it isn’t bullish either. That may well be a more useful bottom line from this investigation. While the Venus-Mars square may not be as bearish as some financial astrologers may believe, it isn’t bullish either. That said, its presence this week also doesn’t preclude further upside in the markets.
Venus-90/270-Mars-0-Ketu
This week’s Venus-Mars square comes with a wild card, however. Just as Venus and Mars form an exact square on Wednesday, Mars will be in an exact conjunction with Ketu, the South Lunar Node. The introduction of a third element into the alignment shifts the range of likely outcomes. On the face of it, Ketu/SN is a natural malefic and its association with Mars — another natural malefic — increases the risk of undesirable events and market weakness. Even if the Venus-Mars alignment is only marginally bearish in its effects, the added factor of Ketu/SN may elevate downside risk as the lunar nodes are said to often act as amplifiers. At least, that is what the usual deductive logic of astrology would suggest. But what does the evidence say?
As it happens, this particular three-planet alignment of Venus-90/270-Mars-0-Ketu/SN has only occurred 4 times in the past 120 years. Twice it coincided with declines, while once it was mostly flat to bearish and the other occasion it actually saw rising prices. The specific breakdown is as follows:
1. 13 Apr 1943 Bearish. -5% in 7 days. Interim low on the day of the exact Venus-90-Mars.
2. 17 Sep 1948 Bearish -3% in 10 days. But interim low occurred 10 days after the exact Venus-270-Mars alignment. Total decline was 6%
3. 20 Nov 1968 Bullish +2% in 10 days and added another 2% in 10 days that followed. Venus-90-Mars.
4. 8 Sep 2018 Neutral to bearish -1% in 9 days. (But Ketu was 4 degrees away from Mars and hence less powerful). Venus-270-Mars.
Obviously, we cannot extrapolate from just 4 cases. However, we would do well to note that this Venus-Mars-Ketu alignment may produce worse market outcomes than just the Venus-Mars square alone. Half of the cases coincided with bearish outcomes, which exceeds any bearish bias that might be assumed from the simple Venus-Mars square.
Implications for this week
The presence of the Venus-Mars square and the Mars-Ketu conjunction this week tilts the balance in favor of the bears. This is not a high probability prediction given the limited available evidence, however. Nonetheless, the absence of significant positive outcomes from these alignments means that further upside is less likely. Moreover, since Mercury turned retrograde on Friday, there is also an elevated chance that the bearish reversal scenario may be activated following the preceding strong run-up in stock prices.
