

 (7 December 2025) Stocks pushed higher again last week as new inflation data was in line with expectations and further boosted hopes for a Fed rate cut. The major US indexes have returned to their October highs and are threatening to push higher as we approach the bullish seasonality of the Christmas holiday period.
This bullish outcome broadly reflected the positive bias of the Mars-Saturn square which is exact on Monday, December 8. Our backtest of previous Mars-Saturn squares provided evidence of a bullish effect on stocks that typically begins several days before the exact square alignment. Other alignments may have further supported sentiment last week as the aftermath of the Nov 24 conjunction of Mercury and Venus is likely to lean bullish also. The post-alignment period of the Jupiter-Saturn trine (Nov 17) is also generally positive, although it is unclear how long its positive effect will last.
Based on the ongoing effects of these three alignments, it is not unreasonable to assume further upside in the markets in December. The Mars-Saturn square in particular tended to correlate with more bullish price effects in the days after the exact alignment. With the alignment due on Dec 8, this influence could put a floor under prices for the next two weeks. While it does not preclude declines, it suggests that dips will likely be bought.
The Mars-Neptune square
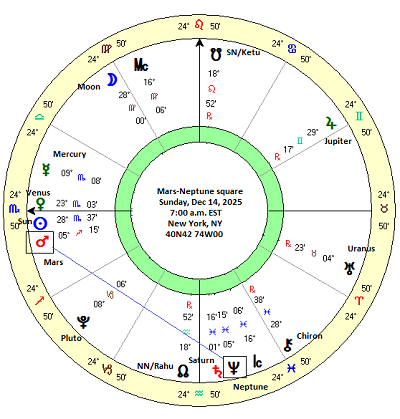
For this week’s study, I thought we could examine the possible effects of the Mars-Neptune square. The next one is due to occur on Sunday, December 14 as Mars is 270 degrees away from Neptune and thus casts its full-strength, 4th house Vedic aspect to Neptune. For the purposes of this study, I have included both the 90 degree and 270 degree squares.
On the face of it, this is another seemingly troubled pairing of planets as squares involving malefic Mars tend to cause difficulty. According to astrological theory, Mars symbolizes assertion, determination and courage, although this can sometimes turn to aggression and frustration when Mars comes under pressure.
As a modern outer planet, Neptune has not been designated as being inherently benefic or malefic as it becomes positive or negative in its effects depending on other factors. In terms of symbolism, Neptune is typically associated with idealism and transcendent ideas such as religious and philosophical beliefs. However, square aspects involving Neptune are often regarded with caution as the tense square alignment tends to bring out the worst in Neptune such as illusion (i.e. distorted idealism), as well as illness and deception. Taken together, Mars-Neptune aspects combine elements of both planets yielding an aggressive or assertive idealism which can bring about unforeseen consequences, especially when these two planets form a square. This negative meaning also bleeds over into financial astrology as conventional wisdom holds that Mars-Neptune squares are likely to be bearish. But as always we have to ask: are the deductive assumptions about this planetary alignment actually borne out by the evidence?
Results
To test this conventional view, I compiled a dataset of stock market prices during the last 67 Mars-Neptune squares dating back to 1970. Using the S&P 500 index as a barometer of relative influence, closing prices at 3-day intervals before and after the square alignment were recorded starting with 21 days before and ending at 21 days after. Thus, each Mars-Neptune square is marked by 15 timed data points which can then be analyzed for trends and patterns. If the standard bearish assumption is correct, we should see a tendency for stocks to fall around the time of the exact square alignment. As the malefic alignment separates and weakens, we should then see prices recover somewhat. While this pairing seems negative on paper, the relatively fast speed of Mars suggests that we would expect only a modest decline in prices since faster-moving planets tend to have short-lived effects. The table below shows all 67 cases with prices recorded at 3-day intervals across a time period 42 days.
The results seem fairly unremarkable. In the summary statistics table below, the first column shows the results for the longest 42-day window (“-21d 21d”). The 67-case average of 0.91% and median of 0.63% are very much in line with the expected value of 0.93%. The expected value was calculated on a pro-rated basis extrapolating from an 8.1% average annual return from the years 1970-2024. Since the results do not differ significantly from this long-term average, we can say that the Mars-Neptune square appears to have very little correlation with the markets across this particular 42-day interval.
Looking across the table, there were several intervals that yielded negative results although none reached the threshold of statistical significance (p<0.05). An honorable mention goes to the “0d 6d” interval which had a p-value of 0.093. This suggests that if there is an effect it is quite inconsistent and very modest. For example, the 15-day interval after the square alignment (the 6th column marked “0d 15d”) had an average of -0.37% and a median of -0.51% compared with an expected value of 0.34%. This produced a fairly low p-value of 0.183 (i.e. the result had an 81.7% probability of not being the result of chance) but it’s fairly high standard deviation of 4.32% was a reflection of a wide and inconsistent distribution of outcomes. So while the results tend to be bearish, there are many offsetting positive results.
If we look a bit more closely, we can see a pattern whereby the negative results tend to be after the exact square alignment. In fact, the exact alignment may act as a pivot for sentiment whereby prices generally rise modestly before the square and then fall afterwards. This is most apparent in the shorter time intervals.
The cumulative trend chart below demonstrates this effect more clearly. Both the average and median lines are well above the expected value line for much of the run-up to the exact square alignment at 0 days (“0d”). But the average line reverses lower at 0d and continues to fall until 6 days after the exact square (“6d”). Even 21 days following the square, the average line never regains its level at 0d. The median line is choppier, however, and makes general assessments more difficult. It peaks earlier at 12 days before the square (“-12d”) and then dips and then forms a second peak 12 days after the square (“12d”).
The fact that the median and average lines do not closely track one another is good reason to be careful about interpreting these results. The median may well be more reliable than the average in this study since our sample included two deeply negative outcomes in October 1987 and November 2008. The Mars-Neptune square occurred just two days before the biggest single-day stock market crash in history on Oct 19, 1987. Also, Mars squared Neptune on Nov 4, 2008, immediately following the massive decline in October which began the Global Financial Crisis. These huge losses connected with these two data points may have skewed the average data somewhat compared with the median data. Therefore, the mostly-bullish line from the median results may therefore be more reliable indicator of the typical effects of this square. On the other hand, the fact that those two historic stock market declines occurred near Mars-Neptune squares it also worth noting.
Disaggregation: the 270-degree Mars-Neptune square only
Since the upcoming Mars-Neptune square on December 14 will be a 270-degree forward square, it is worth backtesting the specific effects of that alignment. Interestingly, the resulting dataset of 32 cases include both the 1987 and 2008 squares that were associated with outsized declines. Thus, the same caveat about averages vs medians also apply to this smaller sample. But at the same time, it may mean that the 270-degree forward square may carry an additional downside risk given the right co-factors and conditions. The summary statistics table below is clearly more bearish than the aggregate sample. Most of the intervals have negative averages although only a few of the medians are negative. However, two intervals reached statistical significance (p<0.05) and a third came very close (0d 15d). The most bearish interval was the 6-day period after the exact square (“0d 6d”) in which both the average (-1.12%) and median (-0.28) were negative and reached significance given the p-value was less than 0.05.
The cumulative price trend chart below highlights this negative effect in the days following the exact square. While the lines are choppy, both the average and median lines peak on the day of the exact square (“0d”) and then decline to varying extents. The average line forms an interim low at 12 days after the square (“12d”) while the median line bottoms at 18 days after the square (“18d”).
Conclusions
The evidence suggests that Mars-Neptune square has a bearish bias, although not in a way that supports conventional astrological thinking. Based on the subset of 270-degree squares, the bearish correlation with stocks occurs after the exact alignment and not before or during as is commonly believed. Up until conducting this study, I thought that the Mars-Neptune square would likely produce one or perhaps two down days within a 2 or 3 day period of the exact alignment. But we have seen that the average down effects only begin on the day of the exact square and then may continue for several days after that. But these are only backtested averages, of course, and do not predict what will happen on or around December 14 when Mars squares Neptune once again.
And even if the upcoming square follows this pattern, we should not necessarily expect any dramatic sell-offs. The average sell-off was only 1.5% from peak to trough while the median decline was just 1%. Of course, there may be the hidden potential for larger declines as evidenced by 1987 and 2008, but those cannot form a basis for our expectations. By itself, the Mars-Neptune square is not correlated with large moves in either direction. It should therefore be understood as a secondary sort of influence which may be big enough to modestly move markets for a few days but is unlikely to initiate a major trend change.
Implications for this week
The evidence suggests that the Mars-Neptune square may be slightly bullish in the days leading up to its exact alignment. With the exact square due on Sunday Dec 14, this alignment should be seen as a mildly bullish influence this week. And yet with no bullish interval reaching statistical significance, there is no guarantee that stocks will move higher.
While the other ongoing alignments such as the Mars-Saturn square and the Mercury-Venus conjunction still could offer further support for stocks this week, it is important to distinguish between low, moderate and high probability influences. Based on our backtests, none of these alignments alone would qualify as a high probability bullish influence, although their combined effects might be considered as having moderate probability.
Perhaps what we can say here is that given the bullish bias of the previous Mars-Neptune squares during their applying (i.e. approaching) phase, a strongly bearish week seems less likely. Of course, Wednesday’s FOMC meeting looms large for both bulls and bears. A continuation of the rally into Wednesday would appear to be the path of least resistance, while bears may be waiting for some selling to take place in the aftermath. That is certainly possible, although the data presented above argues for a delayed reaction that is more likely to begin the following week (Dec 15-19).
If you would like to receive these weekly posts as an email, please subscribe to my free Empirical Astrology newsletter.
Disclaimer: Not intended as investment advice. For educational purposes only.
