

 (27 July 2025) Stocks extended their rally last week as renewed trade deal hopes lifted the major US indexes to new all-time highs. Investor sentiment remains positive as yields in the bond market are not signaling any imminent inflation. While markets had previously feared that Trump’s tariff regime might reignite inflation, the 30-year Treasury yield remains below the psychologically important level of 5%.
Despite the presence of two malefic planets, last week’s Venus-Mars-South Lunar Node alignment proved to be of little consequence. The study of previous Venus-Mars square alignments indicated no particular bias in this pairing, although the previous alignments with the South Node (Ketu) generated more downside on average than random chance would have suggested. But with a sample size of just four cases, we did not have any great bearish expectations.
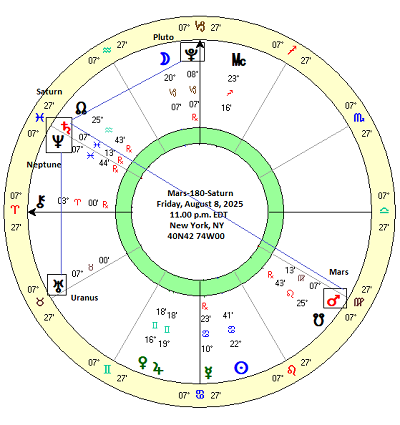
The next major transit alignment may be the opposition of Mars and Saturn, which is exact on August 8. The combination of these two malefics would seem to suggest a bearish bias. This particular opposition is made more intriguing by the fact that Saturn is still in close conjunction with Neptune. Thus, Mars will casts its opposition aspect onto both Saturn and Neptune. On the face of it, that would suggest an even more bearish influence. And we would be remiss if we didn’t mention the fact that all three planets will also form close 60-degree sextile alignments with Uranus and Pluto. Now whether the inclusion of these other two planets might shift the overall effect is another question which I will address next week. But certainly there is good reason to think that the Mars-Saturn opposition at the core of the multi-planet alignment warrants further investigation.
Research Study: Mars-180-Saturn
To get a better understanding of the possible market impact of the upcoming Mars-Saturn opposition, I examined the Trading View database of the Dow Jones Industrial Average (DJIA) dating back to 1896. Based on the 750-day synodic cycle of Mars and Saturn, I recorded closing prices of the past 75 Mars-Saturn oppositions. In order to determine the relative effects of the applying and separating aspects, prices at 3-day intervals were recorded. The first interval was 15 days (“-15d”) before the exact opposition (“0d”) which approximated a 10-degree orb. Other intervals included 12 days before (“-12d”), 9 days before (“-9d”) and so on. The resulting price table is shown below.
In the second table shown below, the price changes across different intervals before and after the exact opposition were calculated. The left-hand column (“-15d 15d”) is the percentage price change during the 30-day window starting from 15 days before the opposition until 15 days after the opposition. The second column (“-15d 0d”) is the price change during the 15-day period up until the exact opposition. Many Western astrologers believe that stronger planetary effects are more likely during this period in which an aspect is applying. The third column (“0d 15d”) is the price change from the day of the exact opposition until 15 days after. A similar three-way breakdown (total/applying/separating) is shown for shorter time intervals across the other columns moving from left to right.
Results
The results were surprising. Rather than being bearish, the Mars-Saturn opposition actually correlated with bullish market outcomes. Taking the longest 30-day window (first column: “-15d 15d”), the average price change was a gain of 1.47% with a median of 1.56%. This compared favorably to the expected change of 0.48% based on a 5.8% average annual return for the period 1896-2023. Random chance would predict about 59% of cases would be positive for any 30-day period, but the 30-day period straddling the Mars-Saturn opposition produced 75% positive results.
As is usually the case with simple two-planet analyses, however, the standard deviation was prohibitively high (3.85%) indicating a very wide distribution of results across the sample. This reduces the reliability of the results since many cases are far above and far below the median of 1.56%. While a bullish outcome may be more likely with this aspect, the number and magnitude of the negative outcomes argues against making any confident predictions.
There was little difference before and after the opposition with both 15-day periods being positive (average = 1.06% before, 0.44% after; median = 1,13% before, 0.75% after) and well above the expected value ot 0.24%. All other intervals except one (“-3d 0d”) similarly exceeded their expected values and displayed the same bullish bias.
Clearly, this is a bullish pairing of planets, even in opposition. This is especially surprising since Western astrologers commonly regard the opposition as more malefic than the conjunction, trine, or sextile.
This same bullish bias was evident when controlling for planetary direction at the time of opposition. 55 of 75 oppositions occurred when Mars was direct and Saturn was retrograde. But 14 oppositions occurred when both Mars and Saturn were direct and they displayed the same bullish bias (“-15d 15d”; average = 1.58%, median = 1.25). Six oppositions were also comprised of Mars retrograde and Saturn direct and these were similarly bullish (“-15d 15d”; average = 3.47%, median 1.68%). (not shown)
Mars-180-Saturn/Neptune
But what happens when we introduce Neptune into the equation? Saturn conjoined Neptune in June and will remain in a close one-degree conjunction until well into August. Thus, Mars will oppose both Saturn and Neptune in early August. Oppositions involving Neptune are usually regarded as bearish, especially when a malefic like Mars in involved. Looking back over the course of the DJIA database, we can see there has only been two times when Mars opposed both Saturn and Neptune: Both were fairly bullish.
1. March 14, 1953 Stocks rose 2% during the 15 days leading up to the opposition and then would eventually fell 2% in the 15 days following the opposition.
2. May 19, 1989 Stocks rose 3% during the 15 days leading up to the opposition, and then were flat during the 15 days following the opposition.
While the 1953 alignment was bearish after the opposition began to separate, the period leading up to the opposition was clearly positive. In other words, this may not be a bearish combination of planets, no matter how malefic they may look on paper. The usual caveats apply when extrapolating from a limited number of cases, however.
Conclusions
Contrary to expectations, the Mars-Saturn opposition seems bullish for stocks. Despite being two naturally malefic planets in a “hard” aspect, this study suggests that stock prices tend to rise around the time of this 180-degree alignment. The net effect (average minus expected) is about 1% for several intervals, i.e. stocks were typically 1% higher than chance would predict. The 24-day, 18-day and 12-day windows were almost as positive as the 30-day window in this respect.
Implications for this week
As we move further into the 15-day period before the opposition this week, there is some reason to maintain a bullish bias here. With the exact opposition taking place on August 8, 15 days prior would start the clock at July 24 (DJIA = 44,693). And yet, the large standard deviation across all intervals means that this is not a robust result that can be relied upon to deliver a bullish outcome. Therefore, it is not a stand-alone trading strategy. As the large standard deviation reminds us, stocks could still decline as a result of this alignment. Even if this study does not provide any easy answers about the impact of the Mars-Saturn opposition, it is always useful to know what its previous track record has been. As we have seen, its bullish history argues against making any overconfident bearish predictions for this early August alignment.
While stocks are clearly overdue for some kind of pullback soon, these results should give pause to investors who are counting on a major decline as we head into early August. A decline is still possible, but the approaching Mars-Saturn opposition could act as an underlying bullish influence which may limit any downside.
That said, the early week conjunction of the Moon with Mars and Ketu may well have a short term bearish bias on Monday and Tuesday.
Next week, I hope to address the broader alignment of Mars-Saturn-Neptune with Uranus and Pluto. Could the ongoing alignments with these outer planets be another reason why the stock market has been in a relentless rally mode this summer?
