

 (23 November 2025) Stocks moved lower last week as hopes for a December interest rate cut dwindled following hawkish comments from some Fed governors. The decline marked the third week of the current pullback which began after the October 29 high on the S&P 500. The negative weekly outcome was not all that surprising given the bearish bias of the late week Mars-Lunar Node square and the near-exact trine aspect of Jupiter and Saturn earlier in the week.
But with the Mars-Lunar Node square exact on Monday, November 24, there may be less bearish energy available this week upcoming. While our study of previous alignments showed only a modest effect, there is some evidence to suggest that markets may become more bullish during the period following the exact square alignment. We noted a similar dynamic with the Jupiter-Saturn trine aspect which tended to coincide with more positive market moves in the days following its exact alignment. Since that alignment was closest on November 17, the odds may be shifting towards some improvement in sentiment in the days to come.
At the same time, the relatively low velocity of both Jupiter and Saturn could extend its bearish influence a bit longer here. Since both planets are close to their respective stations — Jupiter stationed retrograde on November 11 and Saturn will station direct on November 27 — they are moving very slowly and thus will remain in a tight 120-degree angle for some time to come. After last Monday’s most proximate trine alignment of 119 degrees and 51 arc minutes, they are currently separated by 119 degrees and 43 arc minutes of longitude. This remains close enough to remain within effective range and could extend the bearish influence somewhat longer. This ongoing alignment may be one reason why we did not see the market rebound last week despite the initial separation of the Jupiter-Saturn alignment. And as noted, the ongoing Mars-Lunar Node (Rahu) square was another bearish factor in the mix.
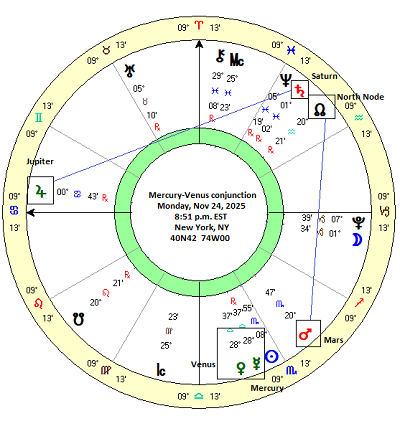
The Mercury-Venus conjunction
This week I wanted to focus on another potentially important influence this week, namely Monday’s conjunction of Mercury and Venus. I must admit I didn’t pay much attention to this conjunction when I was looking at the charts last week. Given its apparent malefic influence, the Mars-Lunar Node square looked more important in terms of potential market impact. On paper, a Mercury-Venus conjunction should be bullish for markets since both Mercury and Venus are naturally benefic planets whereby their conjunction should bring a constructive blending of their energies. In astrological terms, Mercury connotes commerce, computation and intelligence while Venus symbolizes equilibrium, harmony and happiness. Their combination may be seen in terms of a rational harmony or intelligent equilibrium which could support the market.
Of course, that is only on paper. Instead of relying on deductive logic, I think we are better served by basing our expectations on actual empirical data Therefore, I compiled a dataset of the last 62 Mercury-Venus conjunctions dating back to March 2000. If this pairing is indeed bullish for markets, it should show up fairly clearly through an analysis in the stock prices as measured in intervals before and after the conjunction. In order to track the relative impact of the conjunction, the closing price of the S&P 500 was recorded 15 days before the conjunction “(-15d”), 12 days before (“-12d”), 9 days before (“-9d”) and so on until the final price time marker 15 days after the conjunction (“15d”). The table below shows these closing prices for all 62 Mercury-Venus conjunctions from 2000 to 2025.
Results
In order to measure any possible correlations, I compared the price changes across various intervals. These are shown in the summary statistics table below. The first column shows the effects for the longest 30-day interval from 15 days before the conjunction until 15 days after (“-15d 15d”). The second column (“-15d 0d”) shows the price change from 15 days before the conjunction until the day of the conjunction. The third column (“0d 15d”) shows the price changes from the day of the conjunction until 15 days after. The same three-way pattern of comparison is used for the shorter time intervals.
At first glance, the results seem unremarkable. For the longest 30-day interval (“-15d 15d”), the average (0.67%) and median (0.98%) are both slightly above the expected value of 0.47%. The expected value was calculated based on a 5.7% average annual return for the 2000-2025 time period. Besides a modest bullish bias, we can see that the 15-day period before the conjunction (“-15d 0d”) is a bit negative (-0.10%) whereas the period after the conjunction is more positive (0.77%).
This ‘bearish before/bullish after’ pattern occurs in most other intervals as the period before the conjunction is slightly negative while the period after the conjunction is more positive. For the most part, this pattern also occurred in the medians suggesting the correlations are not the result of one or two extreme results. However, the effect was not strong enough to reach statistical significance using the standard 95% threshold of p<0.05. The relatively modest bearish effects are seen in the chart below in which the average is consistently below the expected line, even if the median line remains mostly above the expected line. If there is an effect here, it is quite weak.
Disaggregration: Mercury retrograde conjunct Venus
But it is possible to analyze this sample based on planetary direction. Planets are not always in forward or direct motion as they sometimes have a period of retrograde or backward motion as seen from our vantage point on Earth. This point is especially important as we approach Monday’s Mercury-Venus conjunction since Mercury will be retrograde at the time of the conjunction.
If we create a smaller sample of Mercury-Venus conjunctions when Mercury is retrograde, a different picture emerges. The summary statistics table below shows much stronger correlations across several time intervals for this smaller sample of 19 cases. Although the sample is much smaller, two intervals reached statistical significance with a third almost reaching that crucial 0.05 threshold with a p-value of 0.058 for the 9-day interval after the conjunction (“0d 9d”).
What stands out in the results is that this pairing achieves significance while both bearish and bullish. The 15-day period prior to the conjunction (“-15d 0d) is quite bearish with an average of -1.35% and median of -1.09% compared with an expected value of 0.23%. With a p-value of 0.003, this interval showed significant bearishness. But the 15-day period after the conjunction (“0d 15d”) also reached the significance threshold (0.013) but did so while being bullish. The average (1.16%) and median (0.77%) were both well above the expected value of 0.23%.
This strong negative influence in the time preceding the conjunction is clearly seen in the cumulative trend chart below. Both the average and medians are well below the expected line and bottom out during the 6-day window that starts 3 days before the conjunction and ends 3 days after the conjunction. After 3 days post-conjunction (3d), prices generally rebound although they remain well below the expected line.
Mercury-Venus conjunction: bullish if forward only
We can contrast the bearish effect of the Mercury retrograde conjunction with the conjunction when both Mercury and Venus are in normal forward direct motion. As the chart below shows, the Mercury-Venus conjunctions lives up to its bullish reputation when both planets are moving forward. Both the average and median lines depart from the expected line well before the exact conjunction (“0d”) and continue to rise in the aftermath of the conjunction. This is a clearer bullish effect, although the divergence from the expected outcome is still fairly modest at around 1%.
Conclusion
The data suggests that the Mercury-Venus conjunction is only bullish under certain conditions. Specifically, the conjunction of these two benefic planets correlates with rising stock prices only when both Mercury and Venus are in direct forward motion. Even then, the bullish effect is fairly modest. When one of them is retrograde, however, this bullish influence is negated or rather, delayed until the days after the conjunction. Our analysis of Mercury retrograde actually showed is strong bearish influence in the two weeks leading up to the conjunction. This bearish influence then largely reverted to a more bullish influence in the days following the conjunction.
Implications for this week
In light of the fact that Monday’s Mercury-Venus conjunction occurs when Mercury is retrograde, it is quite possible that we will see more downside in the market this week. But the data suggest that the maximum bearish effect starts to wane about 3 days after the conjunction. With the conjunction due on Nov 24, that only keeps the bearish window open until Nov 27. Of course, there is no guarantee that there will be more volatility this week since last week’s price action was sufficiently bearish to have fulfilled the negative bias of this Mercury-Venus conjunction already.
Nonetheless, the influences still lean bearish this holiday-shortened Thanksgiving week, especially in the first half. The outlook should improve as we get further away from Monday’s Mercury-Venus conjunction and the Mars-Lunar Node square.
If you would like to receive these weekly posts as an email, please subscribe to my free Empirical Astrology Substack newsletter.
Disclaimer: Not intended as investment advice. For educational purposes only.
