

Summary for week of April 11 – 15
Summary for week of April 11 – 15
- Stocks could rise early in the week; weakness more likely by Friday
- Dollar vulnerable to further declines early; rally is likely in weeks ahead
- Crude likely to rise further early but declines possible by end of week
- Gold may rise towards $1500 this week; correction more likely in second half of April and May
Stocks finished mostly unchanged as rising oil prices offset optimism from rising corporate earnings. The Dow nonetheless made new highs for 2011 but settled at 12,380 while the S&P500 did not match its February high and closed at 1328. Given the clustering of aspects last week, I had been somewhat uncertain about the intraweek dynamics. Monday’s Sun-Saturn aspect suggested bearishness but its proximity to Jupiter made a negative outcome less likely. As it turned out, we saw more optimism in the early week period with Wednesday proving to the high for the week on the Sun-Jupiter conjunction. I thought there was a good chance that Wednesday could mark the turning point to the week (or to the month?) and indeed stocks eased back on Thursday and Friday. The Sun therefore acted less as a trigger for the Jupiter-Saturn opposition and more as an astrological pivot point. I am uncertain if that was a significant top, but it was intriguing that the Sun-Jupiter conjunction did mark the high for the week.
While the Jupiter-Saturn opposition has been fairly disappointing thus far, there are several aspects upcoming in April that can act as further triggers of bearish energy. These are short term aspects, however, and may not have the power to move the market in a significant way by themselves. Perhaps more important is the upcoming Jupiter-Rahu aspect that is exact in early May. Jupiter is a bullish planet symbolizing wealth and expansion while Rahu (North Lunar Node) is a more unstable influence that is harder to pin down. When it is more favourably disposed, it can accompany periods of speculative greed where gains occur in leaps and bounds. Its more negative side is associated with distortion and deception and can be quite bearish. So this Jupiter-Rahu aspect could conceivably take the market in either direction, although I tend to think that the negative side will manifest more strongly. At a more general level, it is important to note that Jupiter represents the financial system and this aspect from Rahu could cause some difficulties. One possible manifestation may be that the Fed’s easy money policies that have driven this rally may come under increased scrutiny at this time. This could be the result of an investigation (e.g House Committee) or it may simply reflect the changing perception of the market as QE2 enters its final months. Certainly, Jupiter-Rahu are an inflationary pair of planets since they conjure up images of unlimited excess and growth that is out of control. While we cannot rule out further gains in stocks at this time, it does suggest that strategy of deficit spending and artificially inflating the economy could be in focus here.
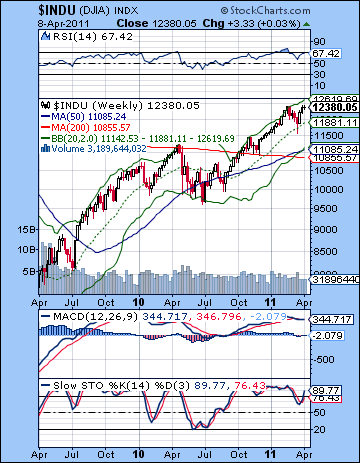 Although the market was unchanged, the technicals are showing some cracks in the rally that would appear to favour the bears. While the Dow made new highs for the year, the SPX did not. This lack of confirmation will be a problem for the bulls until the SPX can exceed 1345. Meanwhile, prices are still moving a rising channel from the 2010 lows with support at 1285 next week and resistance at 1380. These would be fairly obvious levels for investors to go long or short and will no doubt shape the market dynamic in the coming weeks. More immediately, the 20 and 50 DMA may act as support around 1310 in the event of a pullback. The SPX climbed very close to the upper Bollinger band last week which may be considered a lesser test of resistance. This therefore somewhat increases the likelihood of a correction. MACD is flattening out here as the histograms are shrinking and this also somewhat increases the chances that a pullback is in the offing. Stochastics (89) is still in the overbought area which makes long positions less promising.
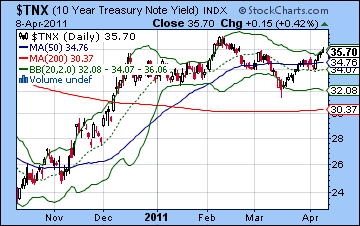
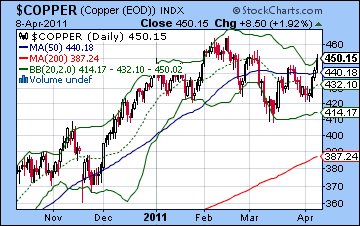
The weekly Dow chart still seems overbought as RSI (67) does have show much more room to run on the upside. MACD is flat and still on the verge of rolling over, while Stochastics (89) are back in overbought territory and now show a negative divergence with respect to previous highs. Support in this chart is likely around the 20 WMA at 11,881 and then the 200 WMA at 10,855. While it’s not a chart that should tempt any medium term bulls, it could still conceivably run further to the upside in the short term. Interestingly, the Dow is within 100 points of its 78.6% Fib level (12,540) going back to the March 2009 low. This could conceivably act as resistance and somewhat increases the possibility that we could reverse lower. Copper continues to do its dance with the 50 DMA around 440. It has clearly been lagging behind equities over the past couple of weeks and may suggest softer demand and slowing economic activity going forward. Its chart shows a series of lower highs since the February peak. Unless it can break above 450 it will remain burdened with the prospect of the bearish head and shoulders pattern. Another important technical factor is the plight of the US Dollar. Stocks fell on Friday despite a falling greenback. This is a very bearish signal for stocks as it may force the Fed’s hand to act to shore up the Dollar by a reduction of liquidity. It’s only one day but it will certainly warrant further watching in case any new trends are established. Treasuries are moving in their usual inverse relationship with stocks, however, as the 10-year hit 3.57% this week. As yields creep higher, it will eventually lure investors out of stocks. But for now, it is simply an indication that stocks are gaining ground.
 This week may see a bullish start but enthusiasm is more likely to wane as the week progresses. Monday begins with the Mercury-Jupiter conjunction that is a fairly reliable bullish signal. Tuesday may also tilt towards the bulls as the Moon is in Cancer and will come under the helpful influence of Jupiter. One possible scenario is that Monday could be lower and most of the gain will occur Tuesday. While it seems a stretch that both days would see gains, there is a good chance that the two day period will be net positive. This presents a bit of problem in terms of the technical picture since the SPX is already running up against some resistance here. It seems unlikely that both days could be higher and push it to 1345 or beyond, although it is still possible. The Sun enters Aries in the second half of the week so that may change the dynamic somewhat. If the market has been higher in the first half as I expect, then this may increase the probability for a pullback in the second half. Also the Sun comes under the aspect of Rahu on Thursday and Friday so that also adds to the likelihood of a bearish outcome. So one scenario would be an early week rise to 1340 followed by another selloff as we move towards Friday. This decline would likely be steeper than last week’s so we could end up below 1320. I would also definitely not rule out a test of the 50 DMA at 1310. Overall, we may not finish too far from where we started, although the possibility of some late week selling slightly increases the chances that we will end up lower.
 Next week (Apr 18-22) features a Mercury-Mars-Saturn alignment at the beginning of the week that has some bearish potential. A larger than normal decline is more possible here. While a down week seems likely here, the Venus-Uranus conjunction on Friday opens the door to at least some upside near the end of the week. I think there is a better chance we could test the 50 DMA at 1310 here and I would not rule out a test of the rising channel at 1285-1290. The following week (Apr 25-29) may also begin on a bearish note as Mercury opposes Saturn right after returning to its forward motion. But the rest of the week looks more equivocal so I would be less inclined to expect significant downside here. Perhaps this week will see the bulls attempt to rally the market back up to the 50 DMA. Early May has a reasonable chance for further declines, however, as Mars and Jupiter conjoin while in aspect to Rahu. This could be a significant move that could break below the rising channel, if it hasn’t been broken already. May or early June seems like the most likely time to mark the bottom of this corrective move. June features no less than three Jupiter aspect (Neptune, Uranus then Pluto) that should help to boost sentiment. July is still quite bullish but the mood will likely darken again in August as the second half of the year tilts towards the bears.
5-day outlook — bearish-neutral SPX 1310-1330
30-day outlook — bearish SPX 1200-1280
90-day outlook — bearish-neutral SPX 1200-1350
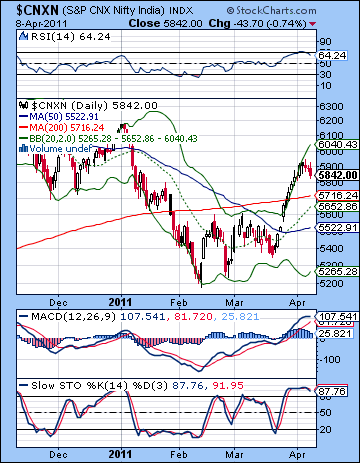 Stocks edged higher in a mixed week as bargain hunting petered out once the indices approached key resistance levels. The Sensex flirted with the 20K level but settled Friday at 19,451 while the Nifty finished at 5842. This overall outcome was not unexpected, although I thought we might see more downside on Monday’s Sun-Saturn’s aspect. I wondered if we might see a more obvious technically driven scenario unfold with the Nifty rising into its resistance at 6000 into the midweek Sun-Jupiter conjunction, and that is exactly what we got. We did get some up move but instead of it occurring around the midweek Sun-Jupiter conjunction, it arrived a little early. Stocks mostly fell for the rest of the week.
Despite the recent impressive rally, the market is still much lower than at the start of the year. Last week’s test of a key resistance level underlined the importance of the current market situation. A break above 6000 and the bull market may resume whereas a failure to do so could start a new cascading decline. The astrological indications suggest a decline is still more likely in the weeks ahead as there are a number of key Saturn aspects in the month of April that look somewhat bearish. The other major aspect to consider is the approaching aspect between Jupiter and Rahu in early May. Of course, Jupiter is a bullish planet that symbolizes wealth and expansion but Rahu is a more elusive influence. It is a chameleon that can alter its effects depending on the particular circumstances of the situation. While it is considered a malefic planet, it can sometimes correspond to bullish situations, especially those that are more speculative and unstable in nature. Rahu is rarely found in periods of slow and steady bull markets. It tends to disrupt the norm and introduce sudden changes or irrational thinking. In its negative form, it is associated with situations of deception and confusion. So the upcoming Jupiter-Rahu aspect may indicate a time when assumptions about prosperity (Jupiter) and confused or exposed as deceitful in some way. For example, the Fed’s QE2 policy of bond buy backs has created a very inflationary environment in many countries including India. One possible manifestation of the Jupiter-Rahu influence would be that this easy money policy may come under closer scrutiny between in April and May. If the consensus around this approach were broken, it might interrupt the trend towards rising asset prices on a global scale. The bottom line is that this Jupiter-Rahu influence seems to tilt bearish, although somewhat less reliably than if Saturn was involved.
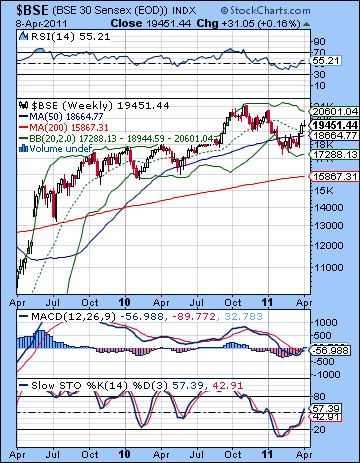 Although the indices gained some ground last week, the technicals appeared worsen. Stocks are currently at a key technical level that tests two trend lines almost simultaneously. The falling trend line off the recent highs comes in just under 6000 on the Nifty and the early week rise retreated once it approached this level. That was an important victory for the bears, although it was certainly expected for a first attempt. It’s also worth noting that the Nifty is now back testing its old support level from the trend line of the 2009 and 2010 lows. This is currently at 5940 and it acted as the brake last week before the Nifty could attempt going for the falling trend line. So this these two lines of resistance will make it very difficult for bulls to push above current levels. Needless to say, a close above 6000 would likely make the bullish case much more appealing. But until that happens, one would think that there will be a significant amount of shorting going on around 5900-6000. And with good reason!
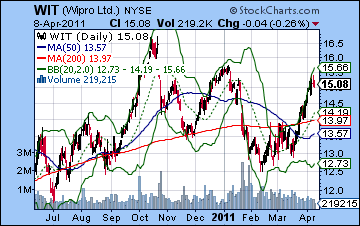
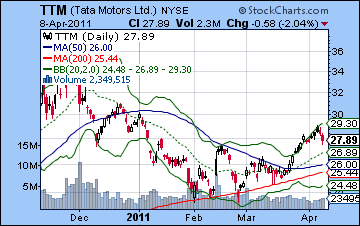
MACD is looking a little vulnerable here as it may be rolling over. Stochastics (87) are also still overbought and are pointing down now. The RSI (64) perhaps provides the best argument for the bears as it hit the 70 line earlier this week and has trended lower. This makes long positions less attractive, although it does not rule out a second run up to the 70 line. If we get more downside soon, then the bulls will have to defend the 200 DMA first at 5716 and then the 50 DMA at 5522. Both levels could operate as significant resistance. By contrast, the weekly BSE chart offers an intriguing MACD pattern for those seeking bull entry points. MACD is trending higher and just about to break above the zero line and it is now on the verge of a bullish crossover. This is not a compelling indicator in my view given that the weekly charts tend to lag the markets significantly, but it is nonetheless interesting in the event of another selloff. Key support levels here are likely around the 20 and 50 WMA at 18,944 and 18,664 respectively. In addition to inflationary pressures, Indian equities may be experiencing a drag from the strong rupee and no more so than the outsourcers. Wipro(WIT) has managed a strong gain in March but faltered towards the end of the week. While the recovery off the February low has been impressive, Wipro has not risen above its January high and therefore remains in a falling channel from its November high — lower highs and lower lows. This is a bearish trend. Tata Motors (TTM) has had a more modest recovery in the March rally. While it could fall back to the 50 DMA, it may well consolidate around that level before moving higher. If the 50 DMA fails to act as support, then it would be subject to more selling.
 In this holiday-shortened week, there is a good chance of beginning on the bullish note as Mercury conjoins Jupiter exactly on Monday and and is still in close proximity on Wednesday. The market is closed Tuesday. It is possible we could see two up days here, although the safer view would be a net positive outcome over two days. Wednesday could also lean bullish as the Moon is strong in Cancer and comes under Jupiter’s protective aspect. It is quite possible that the Nifty will rise on both days. We may therefore get a retest of last week’s highs around 5930 before it reverses lower again. This pattern is also sufficiently bullish that I would also not rule out a higher level such as 5980 which would test the falling trendline. The end of the week looks more bearish so there is a better chance of a decline occurring on Friday. The market is closed Thursday. The Sun enters Aries on Thursday and will come under the influence of Rahu. These days have a good chance of being net negative globally, and we could even get straight two down days on international markets. Friday is therefore a more probable down day in Mumbai. I do think, however, that we will finish at or above current levels, especially if Monday is positive as I expect. A bullish scenario would be a rise into Wednesday to 5950-6000 and then some profit taking by Friday that takes the Nifty back to 5850-5900. A more bearish unfolding would see a down day on either Monday and Wednesday that prevents much significant upward thrust so that the Nifty tops out closer to 5900. The subsequent pullback would leave it closer to current levels by Friday. Either way, I do think an early week rise is a probable outcome here.
 Next week (Apr 18-22) may begin negatively as Mercury and Mars conjoin opposite Saturn. Monday and Tuesday therefore have the potential for a significant decline. The absence of any obvious confirming bearish patterns makes a large decline only possible rather than probable, however. No matter how much downside we might see in the first half the week here, some recovery is likely in the second half as Venus approaches its conjunction with Uranus. Nonetheless, this looks like a down week. The following week (Apr 25-29) also looks bearish as Mercury opposes Saturn in the early part of the week. There is a good chance we could test the 50 or 200 DMA here (5500-5700). Again, we may see some bounce as the week progresses. Early May looks somewhat bearish also as the Jupiter-Rahu aspect will dominate the scene. I am uncertain if we will see a large decline or merely a gradual sideways move with a bearish bias. Some significant recovery is likely in June as Jupiter aspects Neptune, Uranus and Pluto. July also looks mostly positive but the mood is likely to change by August as Saturn comes under the influence of Ketu. This could send the market much lower again. There is a reasonable chance for lower lows in the second half of 2011. I would also not rule out Nifty 4000 or even the filling of the gap at 3500 from May 2009.
5-day outlook — neutral-bullish NIFTY 5850-5900
30-day outlook — bearish NIFTY 5000-5500
90-day outlook — bearish NIFTY 5000-5500
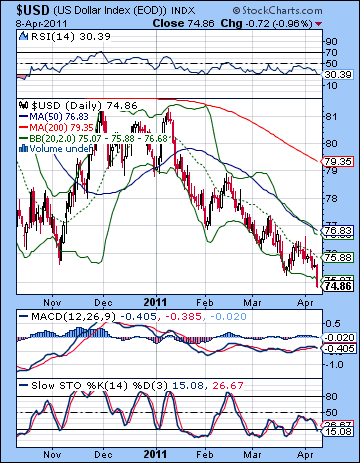 As the US government shutdown loomed, the Dollar lost even more ground last week closing under 75. Despite the prospects for a Portuguese bailout, the Euro ended the week pushing up against 1.45 while the Rupee rose to 44.1. I thought we could finally get some upside here but my forecast was wide of the mark. There were certainly some difficult looking aspects in the proximity but I thought they would hold off until next week. Perhaps they simply manifested early — or else we will have another brutal week to look forward to. The Dollar is is being widely discarded here as it is just a day or two away from matching its lows of 74 from December 2009. As grim as sentiment is, at least there is a chance that it will find support near these levels. The bulls can also point to the RSI (31) as it drifts closer to the oversold level. The 30 line has been a fairly reliable indicator of a bounce over the past few years. What is also interesting is that the RSI on the weekly chart (34) is also close to being oversold. This suggests that a reversal should not be too far away. The daily chart shows a falling wedge forming which bottoms out around 74-74.5. These wedges are usually bullish and when they reverse, they do so with force. Stochastics (15) is also into oversold territory and suggests that a rebound may not far off. We have seen several rally attempts in the past few months but all have failed to gain any traction as they usually turn lower near the 20 DMA or the falling trend line. This is a critical resistance level. The 20 DMA is perhaps less important but a break above the trend line at 76 would likely encourage more money to move back into the Dollar. This is equivalent to 1.42 on the Euro.
This week is likely to extend the Dollar’s woes as Monday’s Mercury-Jupiter conjunction may send investors looking for riskier assets. This suggests that the Dollar could touch support at 74.5 early in the week. By Wednesday, there is a chance that the Dollar may rise with increased probability for gains as we approach Friday. I’m still not convinced the Dollar can rise overall this week, but it is certainly possible given the bearishness from last week. A move lower early in the week would likely take the RSI down to the 30 line or below so that might set the stage for some buyers to move in. Next week looks somewhat more positive although I do not expect the resistance from the falling trend line to tested that soon. A more bullish time might be the last week of April so we could finally see that breakout above 76 and the trend line. In any event, May and June look more bullish than April so I would expect a majority of the gains to occur then.
Dollar
5-day outlook — neutral
30-day outlook — bullish
90-day outlook — bullish
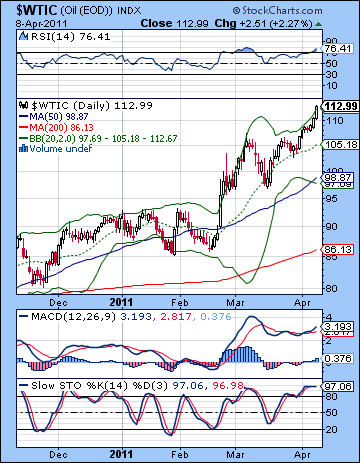 As the war in Libya entered into a stalemate, crude surged higher last week closing near $113 on the continuous contract. While I had expected some gains to occur later in the week, I never thought they would be so large. As if to underscore the bullishness of this market, the early week pullback came and went on Tuesday and barely moved it below $107. It was all bulls after that. The technical indicators are massively overbought now as RSI (77) is again going parabolic here. Stochastics (98) are bumping up against the law of mathematics while MACD is again in a bullish crossover. The weekly chart is also grossly overbought as the RSI stands at a lofty 76. The last time it exceeded those levels was in the summer of 2008 when it touched 80 as crude soared to $147. While it is possible that we could see more upside here, the indicators would tend to dissuade a medium term investor from parking any money in crude oil. Resistance is difficult to say here as the recent breakout has detached price from its previous basing pattern. The next Fibonacci level is around $120-125 so that may be a target that some traders have in mind. Support is likely around $105 which is a previous interim high and also happens to be the 20 DMA. Any pullback to this level would likely bring in new buyers so even if the expected correction occurs, it is unlikely to break through $105 quickly or easily.
This week may bring more upside for crude as the early week Mercury-Jupiter conjunction occurs in Pisces. If there is no gain in Monday’s session, the chances are fairly good that gains will come Tuesday and/or Wednesday as the Moon is aspected by Jupiter. So there is a reasonable chance for further gains into perhaps Wednesday which could push it closer to $115-120. The latter half of the week looks more bearish, however, so some of those gains will likely be lost by Friday. Where we finish up is hard to say — I would not be surprised by any outcome here. Next week could be more bearish as the Mercury-Mars-Saturn alignment could take prices lower. There is a good chance that we could test support at $105. The rest of April also looks more bearish, although I would not rule out the occasional bounce. While it is possible that crude could test support at the critical $97 level at that time, it is not what I would call probable. Early May is harder to call as the Jupiter-Rahu aspect could bring large swings in both directions. There could be a bullish bias for a week or two that could send it back over $100 and perhaps towards $110 again. This will likely be followed by a fairly significant decline in the second half of May. Just where crude will be at this time is an open question. My guess is it could be anywhere between $85 and $100 by early June.
5-day outlook — neutral
30-day outlook — bearish-neutral
90-day outlook — bearish
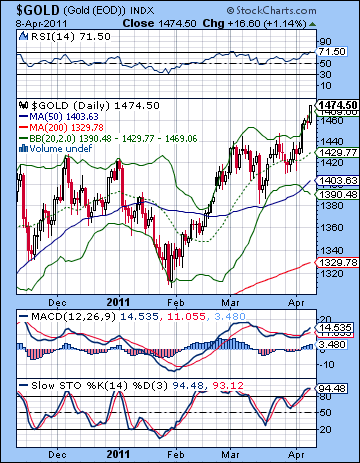 With the continuing struggles of the US Dollar, gold extended its recent breakout rally as it made a new high above $1470. While I did expect some upside this week around the Sun-Jupiter conjunction, I greatly underestimated the extent of the gains here. Monday’s Saturn influence actually produced a modest gain and then it was all bulls as gold took off above the $1440 resistance level. Gold has taken on a new momentum here with its new highs but it is running up against some important technical resistance. The rising trend line from the 2008 lows suggests resistance around $1500, which is just 3 percent away. One or two more up days and gold will quickly run out of easy upside room. It is also overbought on both daily and weekly charts. RSI on the daily is 71 while the weekly is 70. Yes, gold has the potential to be overbought for a while and could run up to 80 for a short time. However, these indicators will make it harder for bulls to go long as the risk will increase of a reversal or at least a correction. Daily MACD is in a bullish crossover although it still shows a negative divergence with respect to the previous high. If resistance is around $1500, support is likely around the sharply rising trend line off the January low. This line runs right through the March lows and now stands at $1430. A close below $1430 would break this unsustainable rise and could hasten a test of the 50 DMA at $1400. This is close to the more important longer rising trend line off the 2009 lows that now comes in at $1390. It is quite possible that a break down of this trend line could begin a major correction in gold. Of course, we have to break that line first.
This week could begin with more upside as the early week Mercury-Jupiter aspect is likely to boost sentiment. I would not be surprised if gold hit $1500 this week. The late week period sees the Sun enter Aries which is normally positive for gold but on this occasion it will come under the aspect of Rahu. This is a more uncertain influence that could go either way. While it may increase volatility, I tend to think that gold will continue to rally right into next week. Some profit taking is likely next week, however, but I am not expecting a huge pullback here. Perhaps we test support at $1450. The odds for larger declines grow as we get into late April and especially May. There is a good chance that we will test the rising trend line support at $1390-1400 in May. Whether or not it breaks remains to be seen. While I previously thought there was a good chance we could break down to $1200, gold’s rise here has made that target less likely. In any event, we could put in a meaningful low sometime in late May or perhaps early June. June looks fairly bullish, however, and the trend may continue into July.
5-day outlook — bullish
30-day outlook — bearish
90-day outlook — bearish