

Summary for week of December 27 – 31
Summary for week of December 27 – 31
- Stocks prone to declines on Mars-Saturn aspect this week; uncertainty from eclipse may undermine Jupiter-Uranus bullish bias
- Dollar likely to rise into early January
- Crude likely to decline after resistance tested at $92
- Gold vulnerable to more downside with further declines possible in January
Stocks continued their melt up for another week as improving economic data and optimism over Obama’s tax cut deal pushed prices towards the upper part of the wedge. The Dow climbed less than 1% in the holiday-shortened week to close at 11,573 while the S&P500 finished at 1256. Well, no surprise here really as the early week Mercury-Jupiter aspect delivered the goods and took prices higher as expected. The S&P made modest gains on the first three days and we ran up against the top of the wedge resistance near 1260 before a tiny pullback on Thursday. The late week bearishness, however muted, also fit with the forecast as the Venus-Saturn aspect corresponded with greater caution and some profit taking. As usual, the late week downside was smaller than expected as the Jupiter-Uranus conjunction continues to buoy sentiment. All this coming of course in the week of a well-publicized lunar eclipse on Tuesday. The eclipse was picked up by most media outlets because it happened to fall on the winter solstice — the first one since 1638. I don’t think there is any special significance to this, although it makes for good copy. What is important is that the eclipse occurred at the time of some powerful aspects, most notably the Jupiter-Uranus conjunction which is just two short weeks away from its exact completion. As I noted last week, eclipse periods often mark changes in the status quo and in stock market terms, they can be correlated with reversals. Stocks have been rising for the past three months with only a small correction so these eclipses are definitely going to weigh heavily on the rally. With the first eclipse now out of the way, the next eclipse will be a solar eclipse which occurs on January 4 — the very same day of the Jupiter-Uranus conjunction. This is really quite an uncanny coincidence that greatly increases the possibility for a move lower. After all, much of the rally has been fueled by the close proximity of Jupiter and Uranus over the past four months since the Fed announced its QE2 plans in September. The market has been riding the wave of bullet-proof rising prices ever since as a complacent insularity has taken the place of actual risk assessment. So the odds seem quite high indeed for a correction very soon — probably starting this week — although I admit that the prevailing influences in January are much less clear than I would like. It would be the picture of simple symmetry if the rally peaked close to these eclipses and the Jupiter-Uranus conjunction and then headed lower into February for a big healthy 20% correction or more. Alas, I have my doubts that things will work out so neatly, but perhaps I’m just a little snake-bit after the failure of the quadruple conjunction in early December to produce any pullback. It seems more likely, and more prudent, that the first dip will be followed by another rally attempt as eager bulls try to put their rally shoes on again. This rally will likely fail sometime in mid-January and then we will likely see another move lower going into February and perhaps March. So what is unclear is whether there is enough juice left in the rally to form a higher high in mid-January after the first correction. I doubt it, but it’s a scenario that I cannot completely rule out.
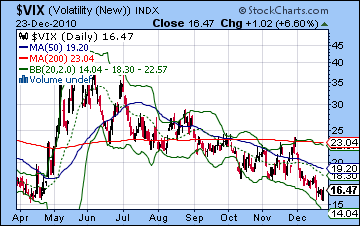
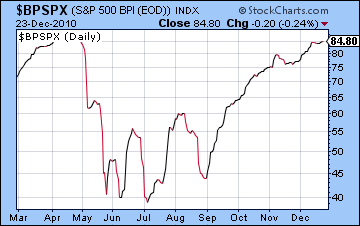
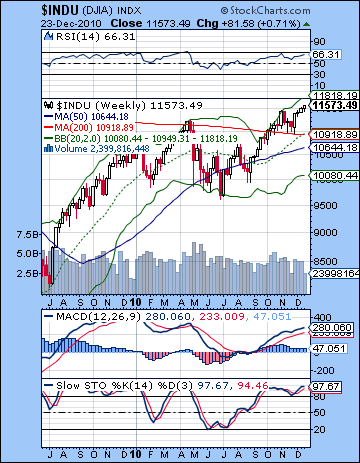 As stocks get bid up, the technicals get more and more overbought. This is definitely not a market to go long in or to stay long in. Sentiment measures are pushing the envelope here as the $BPSPX stands at 84, just a couple of points lower than its high in late April before the flash crash. Obviously, there is no rule that says stocks must correct once they hit this level of bullish sentiment, and we saw this index stay very high for much of the second half of 2009, despite climbing to 90. But it seems unlikely that it can maintain this kind of level without a correction of some sort. The $VIX bounced off historic lows on Thursday below 16 and we got a bullish engulfing candle on Thursday’s session. This increases the likelihood for a correction in the near term as it would appear quite unlikely that the $VIX can fall below current levels. Meanwhile, the Dow has climbed back 78% from its March 2009 lows, and this is a significant Fibonacci level that could spark a potential correction. But if a correction is so overdue, the real question then becomes: how big will it be? The main levels of support are basically in line with the moving averages. Since both the 20 and 50 DMA are still rising, we should at bare minimum expect a pullback to the 20 DMA at 1229. This would be a grade C weak sort of correction that does little to change the fundamental uptrend. The technicals appear too overbought for something so mild, but who knows what rabbits Bernanke can pull out of his hat. RSI is now at 70 while Stochastics stand at a lofty 96. MACD is flattening here and on the verge of rolling over and still in a pronounced negative divergence with respect to the previous peak. A grade B correction might take the SPX down to the 50 DMA at 1207 or thereabouts. Even this would be quite mild since it would still be higher than the previous November low and would therefore keep the rally intact. As long as the correction stopped above the 1175 level, the bullish view of the world could still find adherents without calling into question anyone’s sanity. The situation would change more radically if we broke below 1175 and tested the longer term rising trendline off the March 2009 lines. Currently, this level is around 1125-1130, which also matches the former neckline of the H&S pattern from the late spring. This would be a grade A correction which would cause a more thorough flushing of weak bulls out the market and call into question some lingering doubts about the way forward. As shocking as such a pullback may be given the current level of CNBC-induced optimism, it would only amount to a 10% haircut. And perhaps most importantly of all, if the market then reversed higher it would be a low that was higher than anything we saw in the summer. This would make a more plausible case for another leg to the rally, presumably to a new high, perhaps to 1300 or 1350. At least, that is how such a development would be rationalized on Wall St. And it goes without saying that a close below this rising trendline at 1125 would set off some major alarm bells. I suspect the SPX would quickly descend towards 1040 after that. We will find out soon enough just now much Jupiter gas is left in the rally tank.
 This week looks quite bearish as the midweek Mars-Saturn square may be just the ticket to cash in the eclipse’s chips. While we could see the selloff begin Monday, I would not be overly concerned if Monday actually finished higher. That’s because there is a Mercury-Venus aspect that could push up prices. I still do not fully expect a higher close Monday, however, as the Moon does not seem especially favourable in Virgo with Saturn. Tuesday and Wednesday look more bearish, so they would be better bets for down days in the event that Monday is higher. Tuesday may be more bearish than Wednesday as the Moon conjoins Saturn. There should be a distinctly bearish bias through Wednesday with a good chance of two down days out of three. As the Moon moves into Libra for Thursday, we should see some improvement in sentiment for the end of the week. Friday may be a more positive day on this score. The last two days of the week should be net positive. Overall, however, the week should be lower with a potentially large move down. I think the chances are good that we test the bottom of the wedge and the 20 DMA at 1229 here, and also reasonable odds that we could test 1207 and the 50 DMA. A more bullish scenario would see a slight push higher Monday, followed by a fall to 1230-1240 by Wednesday and then back up to 1250 or so by Friday. A more bearish scenario would see falls on the first three days below 1220 and perhaps 1200 with a recovery Friday to 1220 or so. Given the proximity of the eclipse, I would lean towards some version of the bearish scenario here.
 Next week (Jan 3-7) begins the new year and there is a chance for further downside. The early week is more likely to see gains, however, as Venus approaches its aspect with Jupiter and Uranus on Monday. Tuesday is sort of a wild card day as the Venus aspect is exact and the solar eclipse occurs. This could correspond with a significant rise or, more likely, a significant fall. I would be quite surprised to see a flat market here. The rest of this first week of January looks mostly bearish as Mercury is in aspect with Mars with a possible interim low on late Thursday or early Friday. The following week (Jan 10-14) looks decidedly more bullish as the early week features Mercury aspects with Jupiter and Uranus. January may get more mixed after that initial rise off the bottom although the rebound could last until the 18th or 19th. Things look quite shaky after that, so I would expect the next down leg to occur in earnest then. Whether or not the January bounce is greater than the preceding correction remains to be seen. My sense is the rebound will be less than the initial selloff and we will make a lower high, but I can’t be sure of that. But the odds for a deeper correction begin to build the deeper we go into January and then February, so if the market is still high as of Jan 18, then it will be quite likely that it will begin to fall significantly shortly thereafter and continue selling off into the first or second week of February. I am still expecting a 15-20% correction here in Q1 2011.
5-day outlook — bearish SPX 1210-1230
30-day outlook — bearish-neutral SPX 1210-1260
90-day outlook — bearish SPX 1150-1200
 Stocks drifted higher last week as FII’s did some end of the year window dressing and bought up value-priced shares. In a fairly subdued week, the Sensex climbed 1% to 20,073 while the Nifty finished at 6011. This mildly bullish outcome was in keeping with expectations as stocks rose early in the week with the Mercury-Jupiter aspect. I thought that Tuesday would be the most bullish day here and that turned out to be true as prices rose by almost 1%. Monday and Wednesday were flat or slightly negative, as was Thursday. More disappointing, however, was the lack of any downside late in the week on the Venus-Saturn aspect. While we did see some small downside moves on Thursday and Friday’s open, Friday’s closing gain was more surprising. Nonetheless, the market appears to be behaving according to the general outlines of a bullish Jupiter-Uranus conjunction that will be exact on 4 January 2011. This has introduced a bullish bias to most world markets for the past month or so, and has limited the downside on Indian markets as the specific horoscope afflictions of the NSE and BSE charts have somewhat overridden the general atmosphere of optimism. Last week’s lunar eclipse got a lot of media attention since it fell on the winter solstice for the first time since 1638, but as expected, it did not move markets and did not apparently correlate with any major events. As I explained in last week’s newsletter, eclipses often take some time to manifest the changes that they promise. Since eclipses usually arrive in pairs — one lunar and one solar about two weeks apart — we cannot fully judge the effects of the eclipse window until both eclipses have occurred. The second one is a solar eclipse due on 4 January, the same day as the Jupiter-Uranus conjunction. The fact that eclipses often correspond to trend reversals or at very least interruptions in the prevailing trend is a strong argument for more downside in the near term. And since this eclipse period coincides with a potential reduction in the bullish Jupiter energy once the conjunction is past, we have an even stronger likelihood that change is coming. Some of this may be quite fundamental in nature and could reflect a new way of assessing financial risk. After early January, I would expect safer assets to get a boost in value as the whole notion of risk may be re-assessed in the equity market. Of course, there are sometimes a time lag with these planetary aspects so it is conceivable that the major sentiment shift may not occur until later, possibly as late as the Saturn retrograde cycle in late January. But it is important to recognize that the chances of a down move increases as we move deeper into the eclipse window and then again as Jupiter begins to separate from Uranus after 4 January.
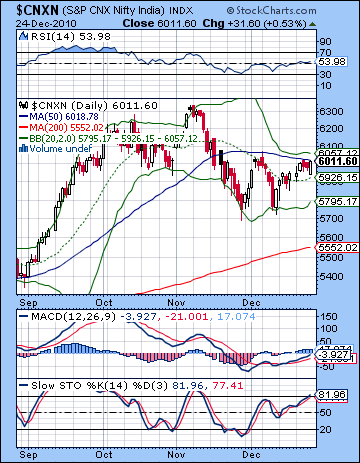
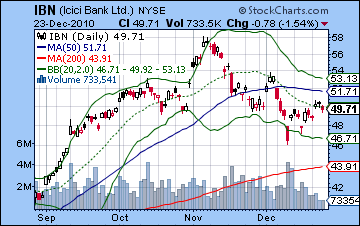
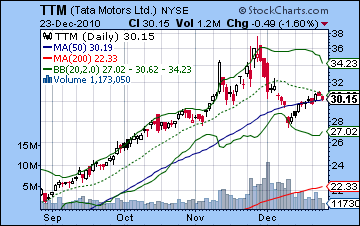
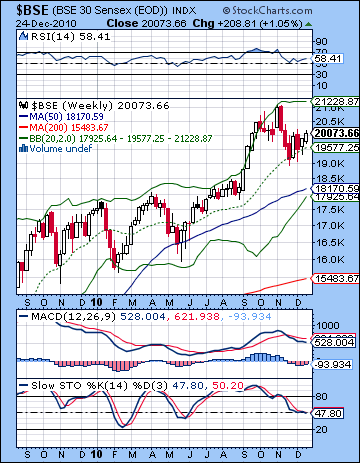 The technical picture continues to be quite uncertain here as the Nifty could not close above the 50 DMA at 6018. It tested resistance on Tuesday last week but could not break above this line and Friday’s close came back up to this approximate level. Failure to break above 6040 would likely encourage a deeper correction as bulls would get quite nervous about not being able to close above this line while the 50 DMA was sloping downward. The Nifty appears to be locked in a narrowing triangle pattern over the past several weeks after the high of early November. The range has narrowed considerably and is now at a point where it must break higher or lower and thus violate the triangle pattern. The indicators suggest a somewhat more positive outlook as daily MACD is still in a bullish crossover and is now rising toward the zero line. It is also in a positive divergence with respect to the high of 6 December. RSI (53) is similarly in a positive divergence now and has risen into bullish territory. Stochastics (81) have climbed all the way back to the overbought area and this may lessen the attractiveness of long positions somewhat. Resistance remains at the 50 DMA around 6020-6040. If the Nifty manages to exceed that level, it could make another run at the previous high at 6300. Current support levels are around the 20 DMA at 5930, with firmer support near the previous lows of 5700-5750. If we do get a pullback this week as expected, it will be critical to see if the 5930 level holds. If it breaks down, then we could fall below 5800 quite fast. While the situation is getting more precarious for the bulls, the weekly chart does help to put things in perspective. Thus far, the correction from November has only tested the 20 week moving average — a very modest pullback indeed. As long as the Sensex can stay fairly close to this line (19,577) the rally will continue to attract new money. MACD is still in a bearish crossover however, and Stochastics continue to slide lower. RSI (58) is perhaps the most positive indicator of the three as it appears to be rising and may be taking another run towards the 70 line. But in the event that the initial 20 WMA support line is broken, the next support level would be the 50 week moving average around 18,000 and we could see that visited fairly quickly if the upper support level does not hold. This would be equivalent to about 5400 on the Nifty and would represent support near the 200 DMA. The charts of individual companies showed a mixed picture with outsourcers such as Wipro and Infosystems showing a lot of strength but concerns remain for laggards like ICICI Bank (IBN). While it rose modestly last week, it has not been able to close decisively above the neckline ($50) of the H&S yet. Until it does, this stock is vulnerable to selloffs. Similarly, Tata Motors (TTM) appears to be running into heavy overhead resistance from the 50 DMA.
 This week tilts towards the bears as the Mars-Saturn aspect may increase caution and make risky investments less attractive. The exact aspect occurs on Tuesday but it may well manifest on Monday. That said, Tuesday looks like the worst of both days since Monday has the somewhat more bullish Mercury-Venus aspect as a potential offset. If the early week is lower as expected, then the chances are good for a recovery late in the week on the Moon-Venus conjunction. This looks strongest on Friday, although its effects could be spread over a couple of days. A note of caution here, however, as the Moon is not a very strong influence and we may not get much upside. By contrast, the Mars-Saturn aspect could be quite potent so it is quite possible that declines will be sharper than any gains we may see. So a bullish unfolding here might see a small rise or flat Monday followed by a somewhat larger decline Tuesday to perhaps 5900 and then a rebound into Friday back to 6000. In other words, a bullish scenario would see the market little changed overall. I can’t quite see this happening on a Mars-Saturn square, but it is nonetheless possible. A more likely outcome will be the bearish scenario where we test support of the 20 DMA at 5930 on Monday and then break through it on Tuesday down to 5800 or so. Wednesday could also be down although probably not as much, before the rebound takes hold at the end of the week and the Nifty finishes around 5850-5930.
 Next week (Jan 3-7) is the first week of 2011 and it promises to be very interesting as the solar eclipse and Jupiter-Uranus conjunction occur on Tuesday. There is a good chance of a gain on Monday and even perhaps Tuesday (although that is less likely) as Venus is in aspect with Jupiter on those days. After that, things will turn bearish again and we could make new lower lows going into Friday. The eclipse here means there price swings could be sudden and severe. I would not be surprised to see 5700 tested here and it could very well be lower than that. The following week looks more bullish as Mercury will again aspect the Jupiter-Uranus conjunction starting on Monday, the 10th. The likelihood of a rebound would appear to suggest that some fairly logical support level will be tested but will hold and this will spur some significant buying. This uptrend may well continue until the middle of the month, perhaps to 18-20 January. Then prices should fall again around the beginning of the Saturn retrograde cycle on 26 January. This next down move will likely continue into the first week of February at least. This probable second down move looks like it will be strong enough to move below the lows we get on Jan 3-7, wherever they are. Then a rally is likely in the second half of February but this may peak in early March and prices will likely be bearish for much of March. I think we will see a lower low in March, probably testing the 200 DMA at 5550 and it may very well be lower than that. The bottoming formation may take place through April and then the market may rally up until June.
5-day outlook — bearish NIFTY 5800-5900
30-day outlook — bearish NIFTY 5800-6000
90-day outlook — bearish NIFTY 5200-5600
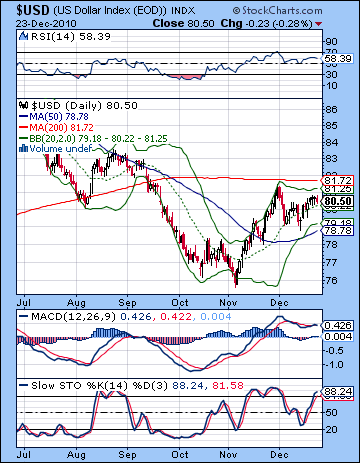 There were no real surprises for the Dollar last week as it edged higher ahead of the Christmas holiday break on improved US economic prospects. I was mistaken in my expectation for weakness on the early week Mercury-Jupiter aspect as the Dollar rose through Wednesday. The inability of the Euro to rally on this normally bullish aspect is increased evidence that the Dollar may well have significantly more upside in the short term. The technicals on the weekly chart suggests there is a good case to be made for more upside as MACD is still in a bullish crossover and well below the zero line. Stochastics (70) are climbing but still have a way to go before they are overbought. RSI (51) has turned bullish and may also take another run at the 70 level as it has in the past. Price has broken above the 20 and 200 WMA and if it should hold on any subsequent pullbacks, this would be a very bullish sign. The upper Bollinger band at 84 would be one possible upside target, although many investors would regard the falling trendline from the previous highs as a more likely end point — around 88. Nonetheless, the daily chart still shows significant resistance just above current levels at the 200 DMA around 81.5. A close above 82 would perhaps entice more buying and take it substantially higher. On the other hand, a close below the 50 DMA at 78.78 would be quite bearish and might signal that the current recovery in the Dollar is over.
This week looks more positive for the Dollar as the Mars-Saturn aspect may send investors out of risky assets. Admittedly, the Dollar has seen gains on positive economic news that has boosted stocks, but there is a good chance that fear factor may re-enter the equation in the short term. While the week looks fairly good for the Dollar, we could nonetheless see some down days, most likely coming in the late week period, especially on Thursday, or perhaps Friday. We could see the Dollar rise to the 81 or even 81.5 resistance level before backtracking a bit. Next week will likely see the up trend continue and there is a reasonable chance that the Dollar could punch through resistance. The middle of January looks less favorable to the Dollar, however, as there are some good looking hits in the Euro chart. This may mark a retracement from recent gains, but probably not all the way back to current levels. When does the Dollar rally end? I wish there was a clearer picture. At the moment, there are conflicting indications with some medium term measurements suggesting that we will see a significant high made in January in the Dollar whereas other measurements point to higher highs in February and even into March. Even with this latter more bullish scenario, there seems to be less of a chance that the rally can continue much beyond Q1.
Dollar
5-day outlook — bullish
30-day outlook — bullish
90-day outlook — bullish
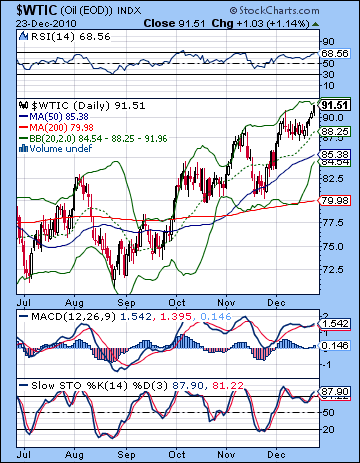 Crude broke out to the upside and finished above $90 closing near $92. While I had expected some upside on the Mercury-Jupiter aspect, the extent of the rise was surprising. Monday saw a gain on the Sun-Mercury aspect and crude never looked back as it put in positive sessions on all four days. It now sits just below the trendline resistance and is pushing up against the upper Bollinger band. The indicators look much more robust here as RSI (68) has erased a previous negative divergence with respect to November highs. While crude is almost in the overbought range here, it could conceivably press higher still. MACD is somewhat less bullish as the negative divergence is still in effect, although it is in a bullish crossover. Stochastics (87) is again overbought but recent rallies have pushed this over 90 before a retracement so further upside cannot be ruled out. That said, the upper trendline resistance is formidable and it may take some time and several attempts to break above this level. What makes it arguably more formidable is that it is equivalent to a 50% retracement from the 2008 highs of $150 in July to the low of $35 in December. The next level would be 61.8% retracement at $104 which might act as a magnet in the event that this $92 level is broken. In the more likely event of a pullback here, some short term support could be found at the 20 DMA at $88. Below that, a more likely resting place would be the 50 DMA at $85 which is very close to the bottom Bollinger band at $84. Support would likely be found around these levels in the event of a correction. Only a deeper correction that took out the previous low of $82 would threaten the current rally in crude, and even then, it may only delay it.
This week looks more negative as the Mars-Saturn aspect will likely reduce risk appetite. While the exact aspect happens on Wednesday, we may see the worst of it on Tuesday due to the involvement of the Moon with Saturn. Monday is unclear and we could well get an up day on the Mercury-Venus aspect. The trouble with that theory is that crude can’t go much higher before breaking resistance. So perhaps Monday’s upside will be limited or only intraday. I would not be surprised to see a large move lower, perhaps 5% over a couple of days, although with Jupiter still approaching Uranus, it’s possible that the downside may be more muted. The end of the week looks somewhat better as the Moon approaches a conjunction with Venus on Thursday and Friday. Next week (Jan 3-7) may see a rally attempt early but more selling after Tuesday and the solar eclipse. The eclipse takes place almost in a hostile square aspect with Saturn, so there is definitely an increased possibility of significant downside. While price may recover somewhat into mid-January — although even that bounce is not certain — the Futures chart does look afflicted as January turns into February.
5-day outlook — bearish
30-day outlook — bearish-neutral
90-day outlook — bearish
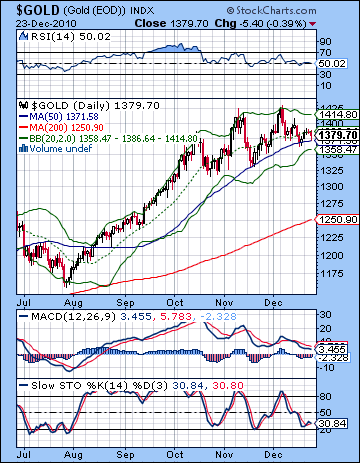 Gold edged slightly higher last week closing just under $1380 as investors bought the technical bounce off the 50 DMA at $1371. I had expected some upside on the Mercury-Jupiter aspect and it arrived more or less on schedule early in the week although it did not quite climb back to $1400. Gold peaked on Tuesday and then the bearish Venus-Saturn started to build and prices eased with a small decline on Thursday when the aspect was closest. While the technical bounce was to be expected, gold sagged back towards the 50 DMA by the end of the week. This is an important level of resistance as price has bounced off the 50 DMA four times in the past two months. A couple of closes below this line would greatly complicate the gold picture and would likely hasten a move lower. MACD is still in a bearish crossover with a significant negative divergence and the RSI is stuck around 50. While it has not gone lower than the previous low around 45, it is in danger of setting up a negative divergence here if it should break below that level. If the upside resistance is around $1400 and then the previous high of $1425, support may be strongest around the $1320 level. This would match the October low and would set up a sideways move. This also matches the 20 week moving average which has acted as support on many pullbacks through 2009 and 2010. In the event of a larger correction, the 50 week moving average at $1220 may well be meaningful support. This is the approximate level of the 200 day moving average at $1250. But there is a danger here that further downside may upset the overall bullish trend as the 20 and 50 DMA may do a bearish crossover. The last time this happened was in July when gold corrected 10%. Gold has only corrected by less than 5% here.
This week leans to the bears as the Mars-Saturn aspect may prompt more selling. The absence of any clear short term afflictions in the GLD chart, however, somewhat undermines the confidence in this expectation. Nonetheless, there is still good reason to expect sellers to outnumber buyers especially early and midweek. There is perhaps a better chance for gains later in the week on the Moon-Venus conjunction on Thursday and Friday. If the selling arrives as expected, then we could see price break below the 50 DMA with a recovery back to that line as a kind of kiss goodbye before heading lower. Next week may see some big moves in both directions with the early week Venus-Jupiter aspect lifting prices — perhaps by a lot. After that, things look quite bearish again with a possible larger move lower going into the second week of January. January therefore seems fairly bearish so it’s quite possible we could see $1320 and even $1220 resistance levels tested. Another rally attempt more likely in February.
5-day outlook — bearish
30-day outlook — bearish
90-day outlook — bearish-neutral