

- Mixed trading with bullish bias into midweek; late week declines more likely
- Dollar mixed but with weakness midweek
- Crude still trending lower but temporary gains are possible
- Gold mixed with upward bias midweek
- Mixed trading with bullish bias into midweek; late week declines more likely
- Dollar mixed but with weakness midweek
- Crude still trending lower but temporary gains are possible
- Gold mixed with upward bias midweek
Stocks were mostly unchanged last week as a variety of global developments took sentiment in different directions. The Dow climbed back after its midweek lows below 11,000 to close at 11,203 while the S&P500 ended the week at 1199 — exactly where it started. This neutral outcome was not unexpected as I had noted the potential for offsetting influences. The week played out roughly according to forecast as we got the bulk of declines in the first part of the week with the second half being more positive. I expected Monday-Tuesday to be net negative and indeed that was the case. I thought Monday would be more positive on the Sun-Jupiter aspect but the intraday gains disappeared by the close. The biggest decline occurred Tuesday, however, rather than Wednesday as the Mercury-Saturn aspect manifested a little early. Thursday was higher as forecast as the Sun-Uranus aspect encouraged more risk taking. I had been studiously agnostic about Friday given the range of influences in play there and the day ended flat. I had wondered (and feared) that the late week simultaneous stations of Venus and Jupiter might push up prices also on Friday but the approaching Mercury-Mars conjunction appears to have canceled out any lingering bullishness there. It seems as though the market is still in the bearish thrall of the Rahu-Pluto conjunction which was exact on November 9. This is a very slow moving pattern, however, so I expect we may be coping with its effects for a little longer, probably until Mercury and Mars join the party in the second week of December. The combined energies of Rahu (uncertainty, greed, distortion) and Pluto (power/coercion, large organizations) appear to be driving the current global financial climate as a growing debate about the Fed’s QE2 is taking center stage. As the Fed prints more money, inflation is being exported to Asia where China’s central bank has had to raise bank borrowing requirements as a means to combating rising prices. Bernanke’s bond buy bank is attempting to kick start the flagging US economy but it is putting the US Dollar under pressure and pushing up the yields on US treasuries. This is not a sustainable situation in the medium and long term as rising yields will force Bernanke’s hand to remove liquidity from the system and force investors back into bonds. The US is skating on thin ice here as China and other foreign holders of its bonds may exact their own revenge for Bernanke’s self-centered policies. If they should dump treasuries, then the US will lose control of the market and yields will spike. Higher yields would force the US government into a corner where it would have no choice but to raise rates and make severe spending cuts. This would open the door to another phase of the recession. We can expect more of these global power plays in the weeks to come as Rahu and Pluto express themselves. With this in mind, it is perhaps also no surprise that European debt has once again re-surfaced with Ireland accepting an EU bailout in order to finance its obligations.
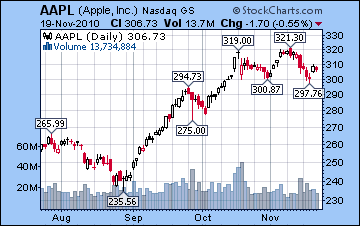
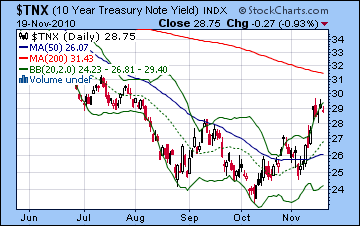
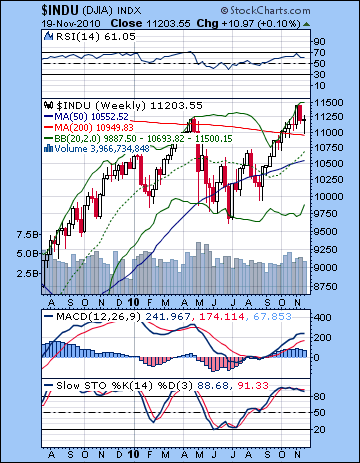 The technical situation continues to provide hope for both bulls and bears. Bulls can rightly point to the successful defense of the 50 DMA and lower Bollinger band on the daily S&P chart on Tuesday. The low was even closer to the 50 DMA on the Dow chart and shows a possible resumption of the uptrend. The 50 DMA is a potentially pivotal support level in the overall up trend. Two previous deep corrections in Jan-Feb and May occurred only once the 50 DMA was broken to the downside. If price should close below the 50 DMA, we could see a "three-peat" which prices tumbling sharply before they find a bottom. The late week recovery took prices back up to the 20 DMA which was perhaps little more than a technical bounce. Pushing price above this level will be considerably more difficult for the bulls, although it should be noted that the top Bollinger band is only 3% away at 1229. Stochastics (34) have turned higher once again after bouncing off the 20 line. This may slightly increase the probability for further upside in the near term. MACD is still in a bearish crossover although the histograms are narrowing. RSI (55) is turning higher again and we can see a series of higher lows dating back to the May correction. This is in keeping with price activity so that offers the bulls some evidence that the rally is sustainable. The weekly chart of the Dow gives more ammunition to the bears as we can still see a negative divergence in the MACD, even while the bullish crossover persists. The negative divergence is also evident in the RSI since the November high is lower than the April high. The Dow is still trading above its 200 WMA, however, so that is strongly bullish. A close below 10,949 would make the bearish case more compelling, but until that time, the bulls can point to this medium term logic as favoring their view of the market. So while the technicals may be seen as somewhat bullish, other charts raise some potential red flags. Market leader Apple (AAPL) may be forming a small head and shoulders pattern here. Unless it may make new highs soon above $321, then buyers may be increasingly tempted to cash out and take profits. As noted above, the fate of US treasuries may be a key factor in the market in the weeks and months ahead. While the 30-year held steady this week, the yield on the 10-year rose and this chart now shows an inverted head and shoulders pattern which, if fulfilled, would indicate much higher yields in the future. Yields are currently right at a key resistance level of 2.90%. If they should move higher, then it may begin a larger move. This would perhaps not be important if it were not for the Fed’s buy back plan. With the Fed acting as a major buyer of treasuries, yields were supposed to fall or at very least hold steady. This has not been case recently. If this trend continues then the Fed may be forced to act and remove liquidity out of the system. This would take investors out of equities and push them back into bonds, thereby driving down yields once again to more comfortable levels. The Fed isn’t quite in a "red alert" zone but it’s moving closer to it all the time. While yields will likely drift higher over the coming weeks, we may only see a significant move higher in January and February.
 With markets closed for Thursday and Friday afternoon for Thanksgiving, we can look forward to reduced trading volumes and likely lower volatility as there is usually a bullish holiday bias. The planets this week seem fairly mixed with a good opportunity for gains on Wednesday but with the rest of the week looking less certain. Monday and Tuesday may well tilt bearish as Mercury still suffers from its conjunction with Mars. Monday is perhaps a better bet for a down day. If Monday is lower, then the chances increase for a gain on Tuesday. If it turns out that Monday is higher, then Tuesday could well see more downside. Wednesday’s Mercury-Jupiter aspect seems like a more reliably bullish pattern. Friday’s half day may begin positively on the Moon-Sun-Pluto aspect, but the enthusiasm may erode by the 1.00 pm closing with a negative close very possible. So it seems we will see at least one down day and one up day with the other two days also splitting their outcomes. I think we could have another rally attempt to perhaps 1210-1215 on the S&P but significantly this will fail to reach previous highs. This would set up the sharper selloff that I am expecting in the next two weeks. A bullish scenario here would see a mostly flat Monday followed by gains into Wednesday to 1215 and then a flat Friday. A more bearish scenario would see a loss Monday to 1190 followed by a flat Tuesday and a gain Wednesday to 1200-1205 with a loss Friday to 1190-1200. The outcome is hard to call here although given my medium term expectations are bearish, I would lean towards the bearish outcome, however slightly.
 Next week (Nov 29-Dec 3) will likely begin negatively as Mars aspects Jupiter. Some midweek gains are possible on the Mercury-Venus aspect but weakness should return by week’s end as Mercury conjoins Rahu. So this has a good chance for a negative week overall. The following week (Dec 5-10) looks more negative as Mars approaches Rahu. The sharpest falls are more likely to occur on the 10th or perhaps on the 13th or 14th after Mercury turns retrograde and conjoins Mars. Just how low we go is an open question as this pattern could pack a powerful punch. It seems likely we will break below the 50 DMA at 1170 but it may not fall too far below the 200 DMA around 1100-1130. We shall see. Then we should see some recovery as the Jupiter-Uranus conjunction takes hold. While this aspect is likely to drive up prices into January, there are a number of potentially offsetting factors such as the Mercury-Saturn aspect in the week after Christmas. We could therefore see a lower high established in January. But the rally should be at least good for a 10% rise and it could well be more than that. For this reason, I would not rule out a rally back up to 1250. This would be even more likely perhaps if we only correct back to 1130 or 1150 in early December. Another decline will likely occur starting in the second half of January and continue into February. This has a good chance of being larger than any decline we see from the current Rahu-Pluto conjunction. January 26-27 look bad, as does February 9-10. A 20% correction is very possible here. Q1 2011 will therefore be negative with some substantial rally likely in Q2. At this point, I think it will be a lower high, perhaps in June or July. Then we make another sharp drop in August and September for what will probably be a lower low.
5-day outlook — neutral SPX 1190-1210
30-day outlook — bearish SPX 1130-1170
90-day outlook — bearish SPX 1000-1050
 Stocks slumped for the second straight week as worsening global financial conditions forced investors into profit-taking mode. The Sensex was down 3% closing at 19,585 while the Nifty sank below the 6K level to finish the week at 5890. This bearish outcome was largely in keeping with expectations given the ongoing Rahu-Pluto conjunction. Unfortunately, some of my daily forecasts were wide of the mark. While I had expected some late recovery Monday on the Sun-Jupiter aspect, I was not fully convinced the market could close higher. It rose by almost 1%. And I thought that aspect would carry over into Tuesday’s open, even if the market would be subject to some bleeding during the session with the approach of the bearish Mercury-Saturn aspect. As it happened, the market tumbled more than 2%. Thursday was higher as expected as the Sun-Uranus aspect did build through the day. Friday’s selloff was somewhat surprising although I had been decidedly agnostic about the outcome here given the influences on both sides. The twin stations by benefics Venus and Jupiter offered the chance for gains but the approach of the Mercury-Mars conjunction was pulling the market in the opposite direction. The bears won out, perhaps highlighting the continuing negative influence of the Rahu-Pluto conjunction. While the bears are in control of the market now, how long can this correction last? There is good reason to expect Rahu-Pluto to act as a drag on the market until the quadruple conjunction of the second week of December when Mercury and Mars will join the bearfest with Rahu and Pluto in Sagittarius. This does not mean that prices will continue to slide every week leading into that pattern. But the combination of three malefics (Rahu, Pluto, and Mars) with one benefic (Mercury) offers a plausible bearish case for a correction that extends for another two to three weeks. Interestingly, we should also note how the symbolism of Rahu and Pluto are reflected in the current financial climate. This conjunction of Rahu (distortion, uncertainty) and Pluto (large organizations, power/coercion) reflects the growing chorus of dissatisfaction with the Fed’s QE2 plan which is devaluing the US Dollar and causing headaches for its trading partners. The war of words shows no signs of ending soon and there is a growing criticism of the Fed move around the world which could harm prospects for equities and US treasuries. Remember that Fed Chair Ben Bernanke desperately needs to hold down bond yields in order to finance the burgeoning US debt. These yields have been creeping higher ever since QE2 was announced in late August. If the market continues to vote with its feet and abandon US treasuries, then Bernanke may be forced to squeeze liquidity out of the system in order to compel more players into bonds. This would drive down yields to more comfortable levels and the US could thereby better service its debt. But squeezing liquidity would spell doom for equity markets as risk appetite would suffer enormously.
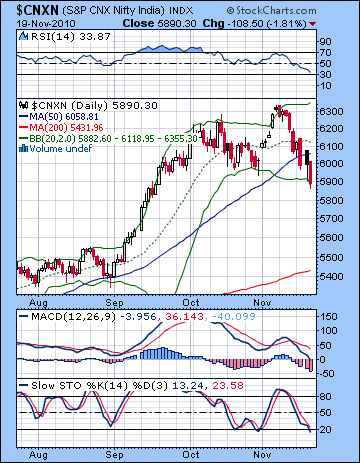
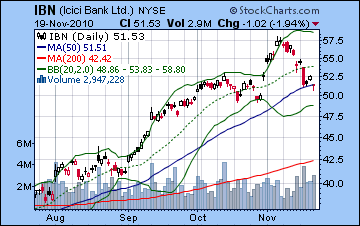
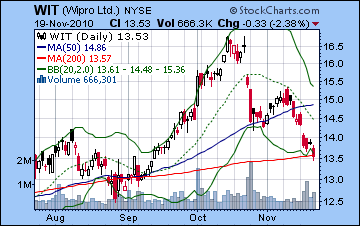
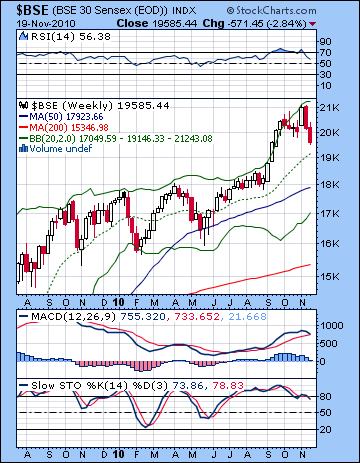 From a technical perspective, bulls suffered greatly last week as the October low was taken out by Friday’s selloff. This broke the longstanding pattern of successively higher lows and now tilts the tables towards the bears. While the Nifty’s lower Bollinger band provided support on Friday, the 50 DMA did not. The piercing of this important moving average is another reason why the bullish case has suffered damage. While the modest August correction did pierce the 50 DMA on an intraday basis, the market did not close below it. This time around, however, we have seen two consecutive closes below. The last time this occurred was in January and May during the larger corrections. In both cases, the market continued to fall another 10% after the 50 DMA was broken. So we will have to see if the 50 DMA now acts as resistance. Daily MACD on the Nifty is still in a bearish crossover but it has now reached the zero line, a possible area of support. Stochastics (13) are now oversold. We can see a negative divergence with respect to the previous lows suggesting that more downside is possible in the medium term. In the short term, however, we could see a rally attempt and a crossover of the two component stochastic lines. RSI (33) is still trending lower and has almost reached the oversold area. Buyers may be more willing to enter the market as we move closer to the 30 line. From a medium term perspective, however, the negative divergence is still very much in play and this suggests that all the gains since August are vulnerable. The weekly BSE chart saw another decline after the previous week’s bearish engulfing candle. Price has yet to pullback to the middle Bollinger band line at 19,140 so this correction is still quite mild in comparative terms. Perhaps more significantly, the weekly MACD chart is rolling over here as the bullish crossover has ended. If this trend should continue, it would be a very bearish development and portends much lower prices in the weeks and months to come. Stochastics (73) has sagged below the 80 line and may also be on their way to a much lower destination. Against a backdrop of Asian central bank tightening, ICICI Bank (IBN) also declined last week. This move closed the gap at $51 on the NYSE chart as Friday’s close is right in line with the 50 DMA. This is clearly a pivotal moment as there could be a rally attempt now that the gap has filled. But the support must be firm at the 50 DMA. If it breaks through, it would likely fall more sharply and may revisit the 200 DMA around $42. In any event, that gap around $46 looks like it will be filled in the medium term. As exporters continue to feel the brunt of the global currency wars, Wipro (WIT) had a terrible week and is now roughly back to where it was in August. Price has slashed through the 50 DMA and is now perched on the 200 DMA. It may well find support here in the near term. In terms of Nifty levels, it is important for bulls that the Nifty close above the 5930. That was the previous support level since mid-September and it has now become resistance in the event of an up move. If it manages to climb above 5930, then the rally may gain some momentum from a technical standpoint. A more comfortable level would be the 50 DMA at 6050 which is now likely acting as resistance. In terms of support, we could well get a bounce around 5700 which would be the bottom of the broadening triangle as well as the old resistance level from the rising channel dating back to 2009.
 This week begins with the aftermath of the Mercury-Mars aspect. This was part of the reason for Friday’s selloff and it may well have enough bearish influence left to take prices lower on Monday also. Tuesday will see this conjunction opposed by the Moon so that is another possible down day. I doubt that both days will be negative, however, and Tuesday stands a better chance for a gain. Wednesday and Thursday are more clearly positive as Mercury aspects Jupiter. Thursday is perhaps somewhat more positive than Wednesday. I would not rule out two straight up days here, although I would not call that outcome probable either. Friday looks more negative as the Sun is in aspect with Pluto. With these mixed influences, we could well finish somewhere close to where we started. Much will depend on Monday’s session. If we get a significant decline of 1% or more, then that may rule out a positive week and increase the chances for a negative week. A bullish scenario would be a mild pullback Monday to 5850 with gains into Thursday that takes the Nifty back over 6000. Friday’s decline would again be fairly mild so we finish around 5900-5950. A more bearish scenario would be a deeper decline Monday to 5800 or lower with only a mild recovery Tuesday. Wednesday’s likely gain would only take it back to 5900-5950 and then it would fall on Friday to 5800-5850. While I believe we are still in a correction mode and have lower to go, I would lean slightly towards the bullish pattern here.
 Next week (Nov 29-Dec 3) looks mostly bearish. The early week Mars-Jupiter aspect could spark some selling. A midweek recovery is quite possible, however, on the Mercury-Venus aspect. The late week could be very negative, however, as Mercury conjoins Rahu while Mars aspects Uranus. The decline we see on Thursday or Friday could wipe out any prior gains made in the week. The following week (Dec 5-10) also looks bearish as Mars conjoins Rahu on Friday. The bearish trend may last until 13/14 December before a significant reversal occurs. If we do in fact get a decline into that date, then a significant relief rally is likely for most of the rest of December. The last week of December will likely see some major selling, however, but the gains may resume into early January. At this point, a higher high in January (>6350) is quite unlikely. The optimism may begin to fade after 11 January and the Mercury-Jupiter aspect. I would expect another significant correction to take place in late January and continue into February. Some recovery is likely in late February and into March but the second half of March and into April looks quite negative again. While it seems unlikely the market can continue to fall from January all the way into April, that is one possibility. Alternatively, we could see a decline into early February that is lower than the December low, but the subsequent rally will be strong. Nonetheless, the March-April correction looks fairly sizable so we can’t rule out the possibility of a series of waves lower. A more reliable rally is more likely in May and June. But 2011 does look quite bearish and I we may even fill that huge gap from May 2009 at Nifty 3500 by September.
5-day outlook — neutral NIFTY 5850-5950
30-day outlook — bearish NIFTY 5400-5600
90-day outlook — bearish NIFTY 5200-5500
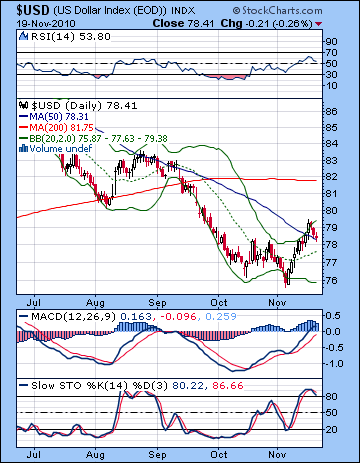 As the whole world cried foul at Ben Bernanke for devaluing the greenback, the Dollar eked out another gain last week closing near 78.5. Despite Ireland’s bailout from the EU, the Eurodollar was unchanged at 1.369 and the Rupee lost ground at 45.4. This bullish outcome was more or less as expected with the early week delivering the gains. I had been uncertain about the late week period and with good reason: the Dollar was lower from Wednesday on. Its technical condition may have reached a fork in the road here as it failed to climb above resistance at 80. This is the neckline of a head and shoulders pattern that goes back to March. The Dollar has already fallen below that 80 neckline and last week was the attempt to climb back over that resistance level and thereby invalidate the pattern. That didn’t happen so there is a chance the Dollar may have headed mostly south from here as the head and shoulders plays itself out. This seems a little too simple to believe, especially in light of the recent re-emergence of the Eurozone problems. But Stochastics (80) may well be heading lower here and this chart does not encourage a lot of bullish type thinking. The weekly MACD is still in a bearish crossover although the histograms are narrowing. It would appear that resistance lies around 79 to 81 which correspond to the 50 and 200 WMA on the weekly chart. 81 also happens to be the 200 DMA on the daily chart. That is a lot of climb over and I’m skeptical about the Dollar’s chances. This translates into about the 1.33 level on the EUR/USD.
This week looks quite mixed with some gains possible at the beginning and end of the week. The midweek looks more bearish for the Dollar as the Mercury-Jupiter aspect is likely to increase risk appetite. Overall, it seems unlikely the Dollar can make much headway this week. Next week and the week after may be somewhat more bullish as the transiting Sun approaches the ascendant of the USDX chart. Perhaps that will take it up to 81. But the Jupiter-Uranus conjunction may be unkind to the greenback so there may be another wave lower through the rest of December. The Dollar should rally after Christmas and continue into early January. I don’t know if this will be higher than 81 but it might be. Another move lower seems likely through February and into March. Interestingly, this may well correlate with stocks moving lower in tandem, a relatively new development. April looks more bullish but May and June seem bearish. A stronger rally is likely in August and September. Overall, however, I think 2011 will generally be bearish for the Dollar.
Dollar
5-day outlook — neutral
30-day outlook — neutral-bullish
90-day outlook — neutral-bullish
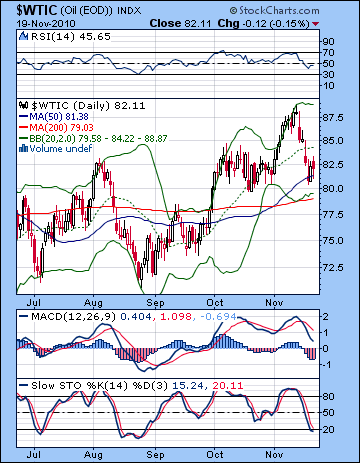 As demand forecasts fell on China’s tightening, crude oil declined to near $82 on the continuous contract. I had expected some downside here, although I was surprised by the extent of the move. The early part of the week was largely negative with an up day on Thursday. Friday was down as expected. While crude has been quite weak lately, it may have found some support here as Wednesday’s low was almost exactly on the 50 DMA. This was tested intraday on Friday and rejected as bulls moved in. Price also stayed above the previous low and this is another possibly sign of a short term recovery. RSI (46) shows a negative divergence with respect to October’s low so that is not positive for the medium term. Daily MACD is still trending lower in a bearish crossover but Stochastics (15) are now oversold. All of which presents a more compelling technical case for going long. At Wednesday’s low, price was within $1 of the bottom Bollinger band so that is another reason to expect some kind of bounce here. In terms of resistance, the upper Bollinger band sits at $89. Given we’ve seen a recent series of higher highs, it would not be outlandish to expect $90 in the event of a rally. This would roughly parallel the April and May highs.
This week looks like a mixed bag as there could be some additional fallout from the transiting Saturn to the natal Mercury in the Futures chart. But this is unlikely to last long as the Mercury-Jupiter aspect on Wednesday seems poised to take prices higher. Friday’s truncated session may be lower, however. Overall, I would lean towards a bullish outcome this week. The picture appears to darken next week as Mercury approaches Rahu. This seems likely to put pressure on commodity speculators and we are more likely to see some selling, especially by week’s end. A low is possible sometime between the 10th and 14th and it may well be below $80. Admittedly, this does not fit well with the cautiously bullish technical picture. Some recovery is likely to begin after Dec 14, with strong gains probable until Christmas. Another down move seems likely leading up to the New Year. Crude is likely to trend lower from late January to early February. I would not be surprised to see the correction extend into April although the indications are less clear.
5-day outlook — neutral-bullish
30-day outlook — bearish
90-day outlook — bearish
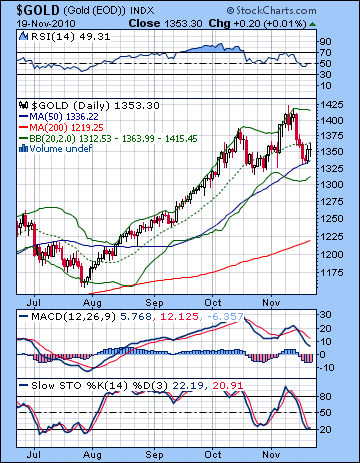 After another volatile week, gold slipped 1% to close at $1353 on the continuous contract. This was generally in keeping with expectations although we got the bulk of the down days in the early part of the week. I had thought we would get at least one up day on the Sun-Jupiter aspect but prices fell on Monday and continued into Wednesday. The technicals on gold look less impressive now, partially due to the possibility of a bearish head and shoulders on the daily chart. A little more upside next week around $1370-1380 and the right shoulder will be there. As potentially bearish as that pattern may be, bulls can take some solace in the fact that they drove prices higher once it reached the 50 DMA at $1330. Friday’s intraday high bounced off resistance at the 20 DMA at $1365 suggesting that enthusiasm was not quite as wild as it has been in previous weeks. But the technicals still look pretty bad here. MACD is still trending lower in its bearish crossover and shows a negative divergence with respect to previous October lows. Over the medium term, this should correct. RSI (49) shows the same divergence and builds the case that gold has further to fall in the coming weeks. Stochastics (22) has touched the oversold line and may be bouncing higher in a possible rally attempt. Overall, this does not present a compelling bearish case in the short term but the the divergences are such that the bears seem more likely to win their revenge. A close above $1380 would be quite bullish as it would exceed the left shoulder while a close below $1320 would break the neckline support and likely hasten a deeper move lower.
This week looks fairly mixed for gold. Monday is somewhat more likely to be lower as we catch the tail end of the Mercury-Mars conjunction. However, we should see some rally attempt going into midweek and the Mercury-Jupiter aspect. Friday’s session may favour the bears. I would not be surprised to see a positive outcome this week, although it is not clear. Next week may well begin quite positively on the Mercury-Venus aspect. I expect sentiment to sour by week’s end, however, as Mercury approaches its conjunction with Rahu. Early December looks bearish as Mercury and Mars will conjoin Rahu and Pluto. With Mercury turning retrograde on Dec 10 in the midst of all those malefic planets, it may reflect quite a volatile situation that could correspond with a serious plunge. Gold should recover before Christmas, however, although it is unlikely to regain its previously lofty levels. The rally could well continue into January but watch for signs of erosion by Jan 20. I would not completely rule out higher highs in January above $1400 but they seem less likely. Much will depend on what kind of pullback we get in early December. Gold should then undergo another major correction from late January into mid-February.
5-day outlook — neutral-bullish
30-day outlook — bearish
90-day outlook — bearish