- Possible declines following Saturn-Uranus aspect
- Dollar strengthening especially early to midweek
- Gold vulnerable to selloff; may fall below $1000
- Crude again falling below $70
- Possible declines following Saturn-Uranus aspect
- Dollar strengthening especially early to midweek
- Gold vulnerable to selloff; may fall below $1000
- Crude again falling below $70
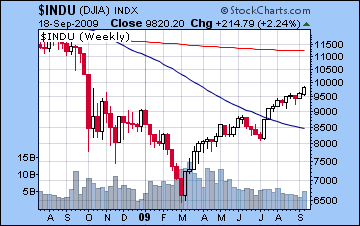
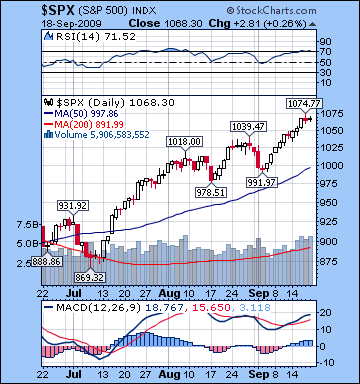 Stocks in New York extended the improbable September rally as a growing number of retail investors joined the fray on continuing signs of recovery. Making fresh highs for the year, the Dow added more than 2% on the week to close Friday at 9820 while the S&P finished at 1068. While I had expected new highs last week, I was wrong in my overall bearish stance as we did not see any late week selling. As disappointing (and maddening) as this never-ending run-up has been, I take some solace in the fact that we have not yet nullified the more general bearish case that can result from the separating Saturn-Uranus opposition aspect. Last week, I offered two possible consequences of this aspect — the first being a significant sell off late week (which obviously did not materialize) and the second which was that the aspect would mark a turning point in the market, not only for the month but also possibly for the year. Depending on what happens this week, the second implication of the aspect is still very much in play as last week may have signified a top in the market. The Saturn-Uranus aspect was exact Tuesday but I suggested that we could see gains up to the addition of a potential triggering planet Venus on Wednesday. In fact, the market rose on all three days before that Venus aspect and the market put in its strongest showing on Wednesday. The Sun and Moon conjunctions to Saturn on Thursday and Friday did little to damper the enthusiasm of the bulls as the market maintained its lofty levels.
The failure of the market to fall on Friday’s Sun-Saturn-Uranus alignment should therefore not be seen as negating the bearish case but merely delaying it for another week as we await the fallout of the Saturn-Uranus aspect. Technically, the new highs look fairly impressive given the rise in volume, presumably on greater participation from retail investors. Depending on one’s view, this may signify an bullish broadening of the rally or a contrarian indicator that could encourage more institutional investors to take profits. Another point of interpretation concerns the proximity of the market to the upper resistance level of the rising wedge pattern. Since March, the market has followed a bearish rising wedge pattern whereby price increases have not kept pace with interim market lows. By some measurements, the market is actually slightly above this resistance level (about 1060/9700) as Wednesday’s gain may have breached that level to the upside. Any future closes significantly above current levels would definitely make life more difficult for bears as it would indicate that the market has broken out of this bearish rising wedge pattern. While a fake out higher is still possible in the days ahead, I think we’re headed lower here. RSI touched the overbought zone of 70 last week while MACD has turned higher. Nonetheless, the negative divergence is still in place as new highs have not been matched by the MACD moving averages. Overall, the technical picture offers evidence to both bulls and bears. Investors should pay close attention to break outs above 1080 which would likely embolden bulls. Also, we should also note that support for the rising wedge sits around 1030/9600. If the market falls below that, it may initiate a stronger wave of selling. Given my bearish stance, this is the more likely scenario, although it could conceivably take another week or two to decisively break that level.
In the aftermath of the Saturn-Uranus aspect, this week will be an important acid test for the bulls as they will attempt to continue their domination of the market. The early part of the week looks more bearish as retrograde Mercury will conjoin Saturn Monday and Tuesday. As an added negative influence, both of these planets will be under the aspect of disruptive Rahu. A significant decline is possible this week and we could test support of the rising wedge pattern of 1030 very quickly. Wednesday could see some bounce as Mars aspects Jupiter, although that aspect could be either positive or negative. Wednesday will have the added difficulty of the Sun-Pluto square which may reduce the chances for significant gains. The rebound may well have to wait under later in the week after Mercury has entered Leo. Thursday and Friday both have chances for gains as Venus forms a parallel with Jupiter. Overall, the market has a good chance to finish lower this week. If it does, then it keeps my intermediate bearish outlook in place for October and November. I still believe there is enough bearish planetary energy available for the market to test the July lows (880/8100).
 Next week (Sep 28-Oct 2) also has an outward appearance of bearishness. The Mercury retrograde cycle comes to an end on the Tuesday, but it does so in a close aspect with Mars. While the Mercury retrograde cycle has failed so far to live up to its bearish billing, it may make up for lost time here. Some gains are possible early on in the week, but late week seems more negative. The following week (Oct 5-9) is perhaps the most negative week of the current period and features Mercury and Saturn conjoining under an exact aspect from Rahu, while still in range of both Uranus and Neptune. To give an extra dose of energy, Mars also conjoins Ketu (exact on Friday the 8-9th) so this really is a potentially explosive combination of planets that could take the market down hard. After that, Jupiter turns direct on October 13 so that may be an early signal of an imminent reversal of energy. The picture seems more mixed going into November as Jupiter will be approaching a conjunction of both Chiron and Neptune, a very bullish influence. At the same time, Saturn will be approaching its square aspect with Pluto (exact Nov 15) , a very bearish energy. So this may more of be a sideways period of rally attempts following by bouts of profit taking. It’s still unclear to me if we will make lower lows in November. Late November into early December seems like a more obviously bullish phase as the exact Jupiter-Neptune conjunction occurs in mid-December. Markets are likely to slip back substantially after that, however, as the Christmas and early January period look difficult.
5-day outlook — bearish
30-day outlook — bearish
90-day outlook — bearish
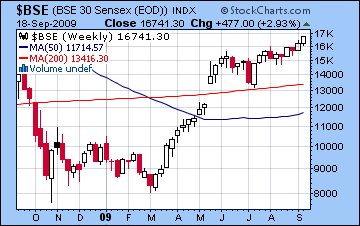
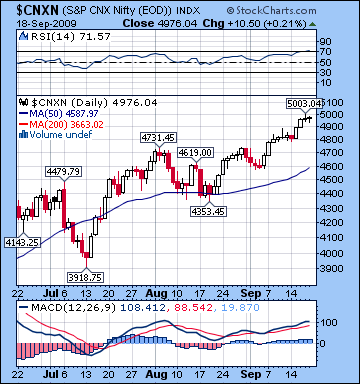 Stocks in Mumbai rose another 3% last week as the rally showed little sign of stopping. After flirting with 5000 on Thursday, the Nifty settled back to close at 4976 while the Sensex finished at 16,741. While I allowed for more upside and new highs in last week’s newsletter, I was wrong in my overall bearish call. After Monday’s modest decline, stocks rose Tuesday and Wednesday and this corresponded with Venus moving into the larger alignment of Saturn, Uranus and Neptune. As expected, most of last week’s gains arrived in the first half of the week, although Thursday and Friday were largely flat with only fractional rises on both days. I have consistently overestimated the extent of bearish influences in recent weeks. The bullish days have been often easier to spot, but the forecast down days have rarely lived up to expectations and have often ended up flat or even slightly higher. This reflects a larger interpretive shortcoming on my part as I have not properly understood the bullish planetary energies that have driven this market higher into September. As I mentioned last week, the Saturn-Uranus opposition is potentially crucial in this respect since there is good reason to expect that is has been a positive influence on stocks in the days leading up to its aspect. Based on previous occurrences of this aspect in 2008 and 2009, we may well see the market move lower once it begins to separate. This week may well tell the tale if we have seen the top or this market yet.
The bulls definitely had something to cheer about last week since the market made new highs for the year on increasing volume which was otherwise lacking in previous weeks. MACD is positive and rising, although the negative divergence remains in place as the market has made higher highs but this has not been confirmed in MACD. And yet until we see a trigger line crossover, there is not a compelling technical case for a correction with this indicator. RSI is 71 and is now officially in the overbought zone so any dips significantly below the 70 line would improve the bearish case for a retracement. Of course, we should remember that markets can stay around the 70 level for weeks without a significant pullback. Perhaps most interesting is the rising wedge pattern that has described the market’s movements dating back to the March low. The rising wedge pattern is a bearish formation that is characterized by higher highs but even higher lows such that the rate of price increase diminishes over time. As buyers eventually become exhausted, the price breaks support and the market pullback substantially and break the upward trend. Last week saw the indices actually break out above the resistance line (4900/16,600), although this did not sufficiently empower bulls to take prices much higher. When break outs are quite small as in the current situation, they are unreliable indicators of future direction since there is a possibility of a false break out, or "head fake". Until the market clearly moves above its current levels, the rising wedge is still be in play. The support from the rising wedge stands at about 4800/16,000. Any downward movement we see this week may test this support and breaks below should be watched closely.
After Monday’s holiday closing, this week features several negative planetary aspects that should take the market lower. On Tuesday and Wednesday, Mercury will conjoin Saturn while both planets will fall under Rahu’s generally bearish influence. While this aspect is not exact, there is still a potential to see significant declines. So far I’ve overestimated the effects of such bearish aspects but there is reason to believe this could be different: this will be the first one to follow on the heels of the Saturn-Uranus aspect. In that respect, it will be an important acid test to see if these negative aspects can gain finally some traction. The bearishness may extend into Wednesday but a reversal is also possible given the Mars-Jupiter aspect. Thursday could go either way, although if we’ve seen a pullback early in the week, then I think the market will be rebounding then. If for some reason, the market has not pulled back, then sellers may move in. Friday seems fairly bullish on a minor Sun-Jupiter aspect. I think there is a good chance we will test the 4800 level and the rising wedge at some point this week. But since some kind of bounce is likely the market may attempt to rally back to last week’s highs to keep the wedge in place. It may only be the failure to achieve last week’s highs that sparks a larger selloff.
 Next week (Sep 29-Oct 2) could also prove to be difficult for bulls as Mercury ends its retrograde cycle on Tuesday in close aspect with Mars. While Mercury’s backward movement has failed so far to coincide with any retracement, this pattern is nevertheless fairly powerful and given the rest of the planets involved does not seem positive. The middle of the week may see some upward movement but the end of the week seems more bearish as Mercury and Mars match velocities. The following week (Oct 5-9) seems even more bearish as there is a complex alignment of Mercury, Saturn, Mars, Ketu, and Rahu. This is perhaps the most likely time for the market could fall sharply, since Mercury will be surrounded on all sides by malefics. A 10% decline over the course of a week is possible here. With Jupiter turning direct on October 13, the subsequent period may be more mixed as potentially negative aspects may be offset somewhat by positive aspect. Once Saturn leaves the harsh environment of Rahu in mid-October, it will move towards an equally difficult encounter with Pluto in mid-November. While this is clearly a negative influence, it is unclear if it will manifest in further declines since it may be partially offset by Jupiter’s approaching conjunction to Neptune. The market may go therefore sideways as we head into November and it won’t be until perhaps late November that substantial gains will occur. Mid-December into January look quite bearish on the beginning of the Mars retrograde cycle so another significant pullback is likely at that time.
5-day outlook — bearish
30-day outlook — bearish
90-day outlook — bearish
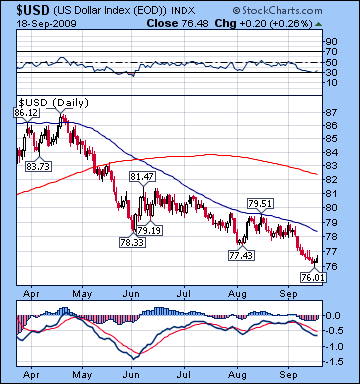 The dollar fell for the third straight week and touched 76 on Wednesday before rebounding somewhat in Friday’s session to close at 76.5. This outcome was somewhat disappointing as I had been more bullish and thought it may have enjoyed more late week upside. Still, I was more or less correct in calling a Wednesday low near 76 as the Venus aspect to the Saturn-Uranus-Neptune pattern increased risk appetite and drove investors out of the dollar. But the Sun-Moon conjunction to Saturn did not produce any big move up and the gloom surrounding the dollar remains largely unchallenged. Technically, there is some reason to be optimistic as the RSI has turned higher after touching 30 and the oversold area. MACD is still solidly bearish while the falling wedge pattern may be forming a new point of support around 76. It’s too soon to tell if this level will hold here although given the imminent (planetary) upside it seems unlikely that the dollar can fall any further. With resistance in the falling wedge around 78, it won’t take much for the dollar to break out to the upside. We may see some testing of that level this week before any decisive moves are made higher.
Monday offers countervailing influences for the dollar as bearish Mars sits on the malefic 8th house cusp of the USDX chart. At the same time, a very tense pattern involving Mercury, Saturn, and Rahu ought to move equities down, so that should be a positive influence on the dollar. Overall, it seems more like we will see a reversal in the recent downward trend this week as on balance the dollar should see higher prices. Next week is likely to continue the bullish trend as a break out above its resistance level of 78 becomes more likely. With Saturn moving through its aspect with Rahu and on to square Pluto in mid-November, there is good reason to expect the dollar to appreciate until that time. A decline is likely into about mid-December followed by another move higher into January.
The Euro continued to gain ground last week as it closed above 1.47 for the first time in a year. While I had been correctly bullish for the early part of the week, Friday’s Sun-Saturn conjunction came up far short of expectations as we saw only a modest decline. As a result, the Euro gained more than one percent on the dollar for the week. Euro seems likely to pullback significantly this week as transiting Mars will square its natal position while Mercury and Saturn oppose natal Jupiter. As Saturn moves closer to the natal ascendant of the Euro chart (5 Virgo), it would seem likely that sentiment will worsen and drive it back below 1.40 at some point in October. Even allowing for some kind of one- or two-week rally as transiting Jupiter aspects the natal Mars in mid to late October, Saturn’s approaching square with Pluto may hit the Euro hard since it will set up just two degrees from the ascendant. While it may not necessarily push it much lower in November, it may limit any rallies. The Indian Rupee closed higher on the week as closed Friday around 48.2. While I had anticipated some gains here, I thought we would see more weakness later on. This decline may manifest this week instead as risk aversion may rise and send investors looking for safe havens. 48.5 is very likely at some point this week, and I would not rule out 49 by next week.
Dollar
5-day outlook — bullish
30-day outlook – bullish
90-day outlook — bullish
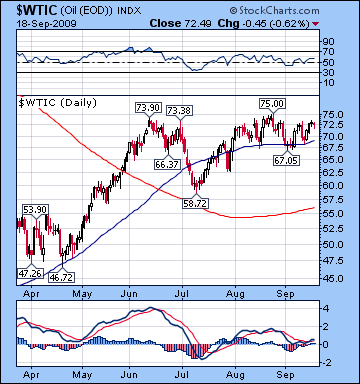 As expected, crude oil rose above $70 last week to close Friday above $72 as the Venus influence to the Saturn-Uranus aspect improved speculative sentiment. This outcome was somewhat more bullish than forecast as I thought crude could not reach $72, especially given the prospect of late week weakness. But with Friday’s modest decline, crude managed to hold its own above key support levels. That said, crude’s decline was out of sync with the gain in equities and is another sign of its greater vulnerability. A bearish rising wedge pattern is fast moving to its culmination so we need to be mindful of any closes below $67-68 which would signal a failure of support and a probable breakout down. RSI is still mostly bullish around 60 while MACD is turning positive. The bearish negative divergence in MACD ought to give bulls second thoughts about any long term move upward. A move down this week or next would add another piece to the bearish head and shoulders pattern.
This week looks fairly bearish on the Mercury-Saturn conjunction although some kind of rebound day is also probable. I would lean towards declines occurring in the early part of the week as the Sun squares Neptune in the Futures chart. Gains are more likely by Thursday as Venus forms a positive aspect with its natal position in the ETF chart. Despite the failure of any big moves last week, the outlook here remains quite bearish as the Futures chart will exhibit two difficult aspects involving slow moving planets simultaneously. First, Saturn will square the natal Rahu in early to mid-October while Rahu will square the natal Mars. This bearish trend may stay in place until Oct 22 when there will be a couple of positive aspects that offer some relief. A rally will develop around the Jupiter-Neptune conjunction as we move into November and December. We can expect another major pullback in crude in late December and January as both Mars and Saturn turn retrograde.
5-day outlook — bearish
30-day outlook — bearish
90-day outlook — bearish
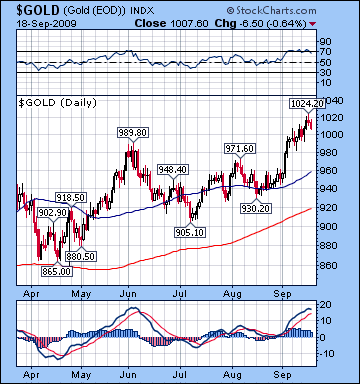 After briefly trading above $1020 on Thursday, gold finished mostly unchanged on the week as it closed at $1007. The week unfolded more or less according to plan as the Venus aspect to the Saturn-Uranus opposition pushed prices higher by midweek. Although I was correct in seeing declines Thursday and Friday, I thought we would see more fireworks given the highly energized situation of the Sun on the Saturn-Uranus aspect. As it turned out, the selling was very muted. Technically, gold seems hugely overbought here as the RSI has been hugging the 70 level for two weeks and the MACD is showing signs of leveling off. After breaking out of its pennant pattern, gold has moved towards its historic highs but has so far been unable to exceed them. That failure to make new highs is one potential issue for gold bulls (and bugs!). Of course, if it can close above 1030 that would be a huge boost to the bullish view on gold. I don’t see it happening here, but it is something to watch out for. We can also see an upward price channel forming with current support around $960. This may be a focal point in the coming week or two as any retracement to that level will likely see bulls try to defend it. If gold fails to hold there, it may slip back to $910 or below by mid-October.
This week gold will be hard pressed to eclipse its historic highs as sentiment is likely to weaken further on the Mercury-Saturn conjunction. Even hanging onto to its current levels seems unlikely given the alignment of bearish planets for early and middle parts of the week. The Sun will square Pluto on Wednesday so that is another layer of energy for gold to contend with. With Pluto so close to the ascendant of the ETF chart this could have a very strong effect on the price. While I am generally bearish here, I would not rule out a surprise spike anytime between Monday and Wednesday. In any event, the planets hold the potential for a sizable price move in either direction. I believe the most likely scenario is down and it could fall significantly. The second and third weeks of October seem to offer a better likelihood of bigger declines, but we should see what this week brings in terms of setting the tone for any possible reversals. Gold could recovery fairly quickly once Jupiter turns direct on October 13 although I don’t foresee any huge rally to take place until late November. Jupiter’s proximity to the natal Moon in the ETF chart may provide a significant level of support but as pessimistic Saturn square Pluto in mid-November, this may offset a lot of the Jupiter bullishness. However, by December and January, the twin retrogrades of Mars and Saturn are unlikely to do any favours for gold and it may undergo another significant pullback.
5-day outlook — bearish
30-day outlook — bearish
90-day outlook — bearish

