

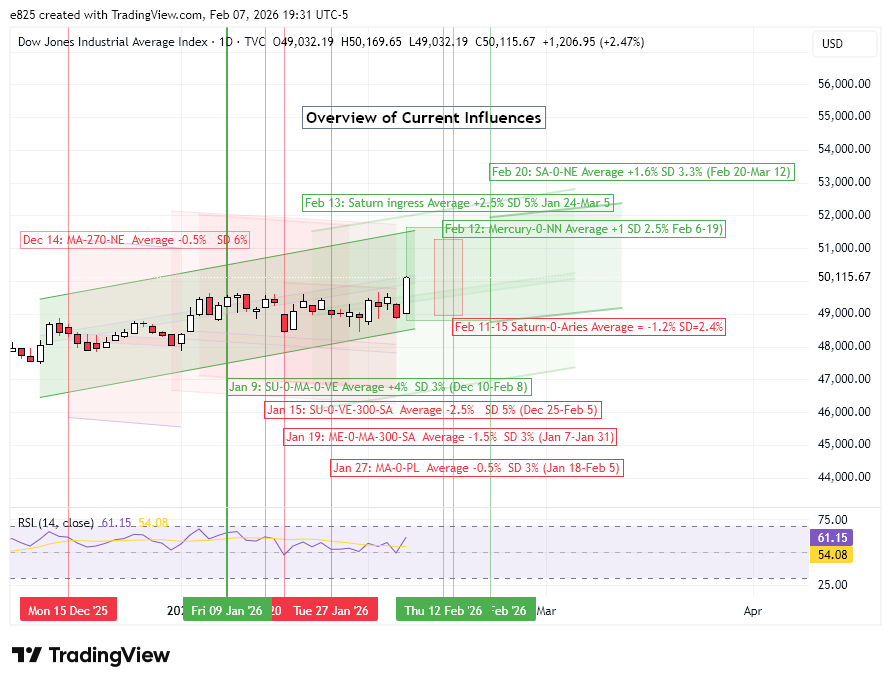
![]() (8 February 2026) After a very volatile week, US stocks rebounded strongly on Friday although the indexes ended mixed. The tech-heavy NASDAQ was still down sharply but small caps and non-tech blue chips were generally higher, with the Dow Jones Industrial Average closing above 50,000 for the first time.
(8 February 2026) After a very volatile week, US stocks rebounded strongly on Friday although the indexes ended mixed. The tech-heavy NASDAQ was still down sharply but small caps and non-tech blue chips were generally higher, with the Dow Jones Industrial Average closing above 50,000 for the first time.
The volatility was not unexpected as I had noted several potential bearish influences including the Mars-Pluto conjunction and the Sun-Venus-Saturn alignment. Although both of these alignments occurred in January, our backtesting demonstrated that both would likely have lingering statistically significant negative influences which could last into early February. The ongoing bullish influence of the Jan 9 Sun-Mars-Venus conjunction and the approaching Saturn ingress into tropical Aries may well act to support the market a while longer.
We can track the progress of these alignments in the cumulative trend charts below. The aftermath of the current Mars-Pluto conjunction (the red line) is reverting to its longer term average and median. Typically, this pairing correlates with some negative returns in the days following its exact conjunction. The period 6 days after the conjunction has the greatest bearish influence although the divergence between the average and the median make this chart harder to interpret. Further downside is possible from this influence, but by no means guaranteed.
The Sun-0-Venus-300-Saturn alignment has mostly moved sideways since Jan 15 and in so doing has largely resisted its historically bearish bias as evidenced by the sub-zero average and median lines. This is potentially unfulfilled bearish influence although time is quickly running out as its maximum effect peaked last week on Feb 5.
No doubt the worst of this aspect has been offset by the ongoing bullish effects of the Jan 9 triple conjunction of Sun-Mars-Venus. This was a rare alignment which backtesting suggested could boost stocks for up to 30 days (or more) after its conjunction. Its potential bullish influence may also be waning now as its most effective interval (Dec 10-Feb 8) is coming to an end. It could continue to boost sentiment beyond Feb 8, but its reliability would be less.
Feb 12: Mercury conjoins North Lunar Node (Rahu)
This week may depend on the effects of the Mercury-North Node conjunction on Feb 12 and the ingress of Saturn into tropical Aries on Feb 13. As we discussed in a previous post, the entry or ingress of Saturn into Aries could have dual effect. Our investigation of previous Saturn sign changes showed a clear bullish bias during a 40-day window before and after the day of the ingress. However, backtesting also suggested an elevated short term downside risk in the days immediately preceding and following the ingress day. The average decline during this 4-day period was only about 1% but it did reach statistical significance. That would be one reason why we could see some down days this week.
But the picture is complicated by the Mercury-North Node conjunction on Thursday, Feb 12. This conjunction usually occurs once a year, although there can be a series of three quick conjunctions if it occurs during Mercury’s retrograde cycle. While the North Lunar Node is seen in a mostly positive light in Western astrology, Rahu, as it is known, is considered a malefic in Vedic astrology as it is associated with disruption and unpredictability. Mercury-North Node conjunctions therefore do not have an obvious reputation one way or the other. All the more reason to do some empirical research and see what the data says.
The table below shows closing prices for the Dow Jones Industrials (DJIA) across a series of 3-day intervals before and after the conjunction. The sample includes all 52 conjunctions that occurred between 1990 and 2025. The first recorded price was 18 days before the conjunction the last recorded price was 18 days after. The transit of Mercury was numbered 1, 2, or 3 depending on its position during the retrograde cycle. Mercury is in direct motion when it makes its first conjunction with the NN and retrograde when it conjoins it for a second time. It returns to direct motion when it conjoins it for a third and final time. This may prove to be significant since Mercury will turn retrograde on Feb 26 and so it will have two more conjunctions with the North Node in March. The direction of the North Lunar Node was also recorded — direct or retrograde — in order to determine if its direction might have a effect on prices.
The summary statistics table below shows the price changes across various intervals. The first column (“-18d 18d”) shows the price change from 18 days before the conjunction to 18 days after. The average of 0.77% is very close to the benchmark figure of 0.80% and suggests there is little to no effect. However, the median increase is much larger at 2.05% and could reflect an underlying bullish bias. There may be limited evidence for a bearish bias during the approach of the conjunction as seen in the second column (“-18d 0d”) which shows a slightly negative average (-0.12%). However, the median (0.37%) does not confirm a bearish bias as it is in line with the benchmark figure of 0.40%. The benchmark is based on a 8.1% average annual return in the Dow from 1990 to 2025.
Only one interval reached statistical significance: the interval from 6 days before the conjunction to 6 days after (“-6d 6d”). Both the average (1.15%) and the median (1.27%) were well above the benchmark of 0.27%. For our purposes, this interval is the most important in terms of market forecasting as its p-value of 0.025 broke below the standard threshold of 0.05 indicating a greater than 95% probability that the result was not due to chance. Applying that interval to the current conjunction, the period from Feb 6 to Feb 18 may well exhibit some of this bullish effect.
The cumulative trend chart below illustrates this bullish effect. The average and median lines bottom out about 6 to 9 days prior to the conjunction and then begin an uptrend that lasts at least 18 days after the conjunction. For the current conjunction, that means this conjunction could exert a modest bullish effect until 18 days after Feb 12, or until March 2. However, the 12-day window straddling the conjunction shows a stronger and more reliable bullish effect. The current line (in red) reflects last week’s volatility and may not provide any obvious clues about this week upcoming. Will be continue to rise or will it first revert lower to the long term averages? Both scenarios are possible. But we should be aware of a 1.0%-1.5% bullish bias in this Mercury-North Node conjunction over the next 10 days or so.
We should also note that there were no major differences in the price outcomes during the first, second or third Mercury conjunctions, nor with the North Node being either retrograde or direct. However, there was some evidence to suggest the third and final conjunction was a bit more bullish than the other two. We will revisit these small differences when Mercury conjoins the North Node again on March 17 and March 26 after it turns retrograde.
Implications for this week
The potentially offsetting effects of these two alignments make this week more difficult to forecast. There is a clear bearish bias when Saturn changes signs, and even more so when Saturn enters tropical Aries, its sign of debilitation. However, this effect could be short-lived and may only last a day or two. The 4-day interval around the ingress (“-2d 2d”) was most negative in this respect although the downside need not extend across 4 days. For the Aries ingress, the average decline was -1.79% for the 2 days before the ingress (i.e. Feb 11-13). Even if this result almost was statistically significant (p=0.079), it is hard to put much faith in a study that has only 8 cases.
The larger sample that included all Saturn ingresses was also bearish at the time of the ingress, although less so at just -0.33% for the 4-day window. It also failed to reach significance at 0.169, although it came close. Taken together, this Saturn ingress influence is reason to be somewhat cautious this week, although it is also possible that the Mercury-North Node influence could cancel it out.
If the Mercury-NN influence follows its historical averages, then its bearish low has already occurred last week which was 6-9 days before its Feb 12 conjunction. That should clear the path for some upside this week and into next week. So even if we get some Saturn-influenced selling this week, it is unlikely to last long.
Looking ahead: Saturn-0-Neptune Feb 20
Next week, we will examine the possible impact of upcoming Saturn-Neptune conjunction that occurs on Friday, Feb 20. This is a very rare conjunction that occurs once every 35 years. The last one occurred in November 1989 and coincided closely with the coming down of the Berlin Wall and the end of the East German communist regime. Like the Saturn ingress into Aries, the relative rarity of the alignment creates problems for creating a decent-sized sample since the Dow price data only goes back to 1896. As it is, there is data for only 8 previous conjunctions, and 4 of those involve the back-and-forth of retrograde cycles. One workaround could be to build a larger sample size using other primary Saturn-Neptune alignments, such as the square and opposition.
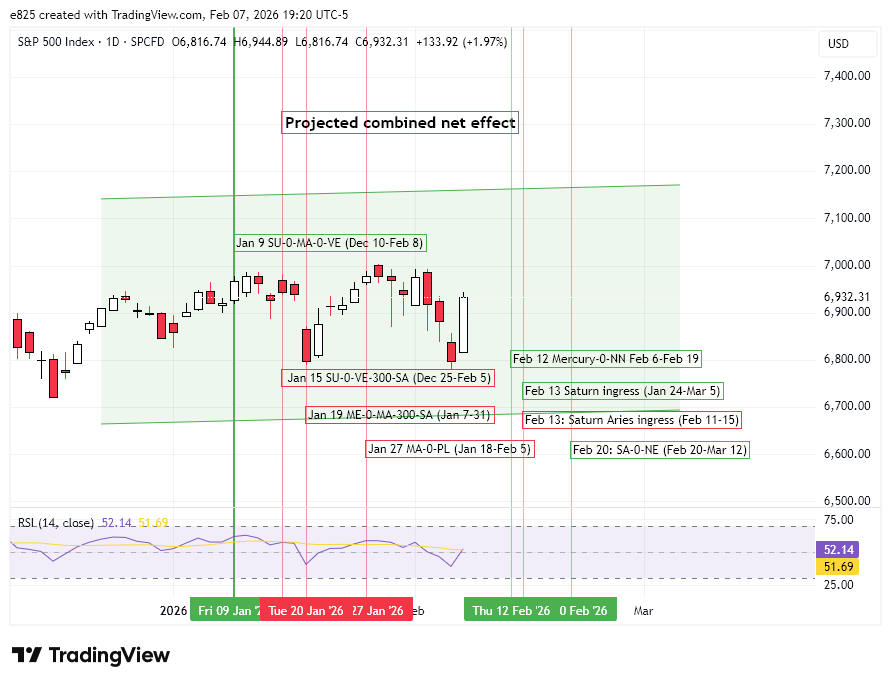
I have already looked into this expanded dataset and found some interesting bullish correlations, although they are fairly modest and largely confined to the period after the exact aspect. I have added these alignments and their statistical attributes to the annotated charts of the DJIA and SPX. Next week, we’ll crunch those Saturn-Neptune numbers for real.
Disclaimer: Not intended as investment advice. For educational purposes only.
If you would like to receive these weekly posts as emails, you may subscribe to my free Substack newsletter, Empirical Astrology.
