

 (21 December 2025) Stocks were mixed last week as the inflation rate ticked lower while manufacturing data showed more signs of weakness. The NASDAQ and S&P 500 ended the week slightly higher while the small cap Russell 2000 and Dow Jones Industrials were lower.
This mixed outcome was broadly in line with expectations although the evidence from previous Mars-Neptune and progressed Mercury-Saturn alignments suggested a bearish bias was more likely for the week. Nonetheless, most stocks were lower into Wednesday and thus better approximated this negative lean from those active alignments. Interestingly, the Dec 17 low exactly coincided with the day of the 330-degree progressed Mercury-Saturn alignment in the NYSE chart.
With Mercury and Saturn now separating from their progressed alignment, it is worth considering the possibility that stocks could now continue higher from here. However, the data is far from clear on that question. The aggregated sample of all alignments of 30-degree multiples (0, 30, 60, 90, 120, 150…) indicates below-normal returns only occurred after the exact alignment, bottoming out at 20 or 25 days after. This would equate to a modest bearish bias from Dec 17 until Jan 6. But since no time interval reached statistical significance, it is difficult to extrapolate outcomes with any confidence. Weak sauce, as they say. This is, at best, a negative background influence which may reflect a drag on the upside without necessarily producing further declines.
Slightly bearish: progressed Mercury-30/330-Saturn
A disaggregated sample of analogous alignments of 30 and 330-degrees are more directly relevant, although with only 9 cases, it is likely too small to make a reliable forecast of future price movement. Nonetheless, the bearish effects are stronger in this sample with one interval (20 days prior to 0d) reaching statistical significance even with just 9 cases. This would equate to Nov 27 to Dec 17 our the current situation. This bearish effect did actually come to pass again as the S&P 500 declined by 2% during that time window. In that sense, we could conservatively say that the negative potential of this alignment may have already been fulfilled by recent price action.
However, we should note that there is a second dip in last week’s cumulative trend chart (n=9) that bottoms out 15 days after the alignment which would equate to Jan 1. It is therefore still possible that markets remain under pressure for the rest of December. But since the effects are weaker after the alignment and with no further statistically significant results in those post-alignment time intervals, a neutral but cautious stance may be more prudent.
Still bearish: Mars-270-Neptune
We should also note we are still within the active window of the Mars-Neptune 270-degree square. This alignment occurred on Dec 14 and backtesting of previous squares showed a clearly bearish effect during its aftermath with a possible low occurring from 12 to 18 days after. Two time intervals were statistically significant and thus reflect the relatively stronger effect of this alignment. If history were to repeat, this would equate to an interim low taking place from Dec 26 to Jan 1. Of course, history never repeats, but it can rhyme. While exact forecast dates should be taken with a grain of salt, the overall message suggests that some caution is warranted.
Taken together, the effects of these ongoing alignments still keep the door open for some downside in the market, even if this is becoming a somewhat less compelling position after last week’s action. While an interim low is still very possible later in December, we need to focus our attention on the next major alignment, namely the upcoming Sun-Mars conjunction on January 9.
Enter the Sun-Mars conjunction
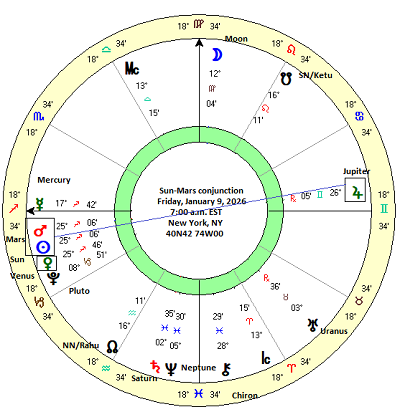
In early January, the Sun and Mars will complete their 26-month synodic cycle forming an exact geocentric conjunction on January 9, 2026. Although all alignments involving Mars carry a certain bearish risk, it is unclear how bearish this conjunction with the Sun will be. According to conventional astrological thinking, the Sun and Mars are believed to have complementary energies which may work well together. The Sun symbolizes confidence and leadership while Mars is association with action, courage, and sometimes conflict. A synergistic combination may be more likely with the conjunction rather than the square or opposition. As an added wild card, this Sun-Mars conjunction will be part of a near-exact triple conjunction with Venus. If the Sun-Mars conjunction carries some risk, the presence of benefic Venus in the mix would seem to more positive. In any event, since the effects of this conjunction are uncertain, it makes sense to systematically analyze previous alignments in order to better understand of its possible effects on January 9.
Method
In order to estimate the possible market effects of the Sun-Mars conjunction, I compiled a dataset all 59 previous conjunctions starting from 1897. The limitations on the historical data are the result of the Dow Jones Industrials Index which was launched in 1896. Closing prices at 5-day intervals were recorded starting at 30 days before the exact conjunction through to 30 days after the conjunction. The resulting 60-day window approximates an 8-degree orb for the conjunction.
While astrologers differ on the proper orb or effective range of an aspect, 8 degrees is not out of line with standard usage which is typically between 5 and 10 degrees. If this conjunction is bearish in its effects, it should manifest in price declines at some point during this 16-degree window around the conjunction. If it is bearish, most astrologers would likely focus on the period closest to the exact conjunction as being most vulnerable to declines. The table below shows prices on the DJIA before and after each Sun-Mars conjunction.
Results
The summary statistics table below describes the price changes across various intervals. Both average and median are included in order to grasp the bigger picture in the event the data is skewed by outliers. The standard deviation, T-score and p-value offer ways to assess the distribution of the data and the extent to which is may be the result of random chance. Using a standard 95% threshold for statistical significance (p<0.05), we note that several intervals were statistically significant and two came close (marked with an asterisk) as their p-value was below 0.10 but above 0.05.
What is impressive in this data is that all the significant results indicated a bullish effect. The first column was the longest interval (“-30d 30d”) had an average of 2.17% and median of 1.89%. This far exceeded the expected value of 0.89% based on an average annual return of 5.4% for 1897-2023. While the result didn’t quite reach significance, it came close at 0.096. In other words, the p-value suggests there is a 90.4% probability that the result was not due of chance. Pretty good odds, in other words. Overlaid to the current period, this historical performance suggests there is a 90% chance of an increase in the DJIA from Dec 10 until Feb 8. (i.e. 30 days before Jan 9 until 30 days after). However, since the difference is only 1% from the expected result, the size of any gain could be fairly modest.
Shorter intervals were also decidedly bullish including the 40-day interval (-20d 20d), the 20-day interval (-10d 10d) and the 10-day interval (-5d 5d). The period leading up to the conjunction seems to be a bit more bullish than the period following it, although the difference isn’t that large.
The bullish impact of the Sun-Mars conjunction can also be seen in the cumulative trend chart below. Both the average and median lines quickly move above the expected value line and experience their most bullish and steepest move leading up to 0d, the day of the conjunction. Perhaps surprisingly, the bullish influence is very much in evidence well after the conjunction as seen in the continued rise in the average and median lines throughout the course of the long 60-day window.
So not only is there nothing bearish about the Sun-Mars conjunction, it is a clearly bullish influence on the markets. But what happens when we introduce Venus into the mix?
The Sun-Mars-Venus triple conjunction
The upcoming Sun-Mars conjunction on January 9 is a bit unusual since Venus will also be close by. On January 9, Venus will be less than one degree away from the Sun-Mars conjunction, having conjoined the Sun on January 6 and Mars on January 7. This triple conjunction occurs fairly regularly with 15 previous cases since 1897, although that assumes a fairly wide 12 degree orb between Venus and the Sun-Mars conjunction. This particular triple conjunction is very close — just one degree. But in order to create a larger sample size of 15 cases it is not unreasonable to use the wider orb.
The summary statistics table below suggests that the addition of Venus to the Sun-Mars conjunction produces even more bullish outcomes. Despite the much smaller sample size, we still see a couple of intervals reaching statistical significance for bullishness — “-30d 30d” and “-20d 20d”. The longer 60-day window had a 3.75% average gain and a 4.01% median gain, both well above the 0.89% expected value. The 40-day window (“-20d 20d”) was perhaps the most consistently bullish interval (p = 0.003) with an average gain of 2.97% compared with an expected value of 0.59%. The evidence suggests this triple conjunction is more bullish than the simple Sun-Mars conjunction.
The cumulative trend chart below highlights this strong bullish effect. The entire period 30-days prior to the conjunction is above the expected value line and the divergence only gets wider in the aftermath of the conjunction. There is a hypothetical peak about 20 days after the conjunction which would translate into January 29, 2026 for the current set up.
Conclusion: a bullish start to January?
The evidence from previous Sun-Mars conjunctions suggests the market is more likely than not to have a bullish bias to start the New Year. The addition of Venus to the conjunction — to say nothing of the opposition with bullish Jupiter — increases the odds for some decent upside in January. And given the fact that the bullish trend lasts well after the exact conjunction, it seems likely that gains will continue into the second half of the month. Despite this strong correlation, it’s always a good idea to remember the investing mantra that ‘past results are not a guarantee of future performance.’ Nonetheless, the evidence suggests the bulls could have the edge in January.
Implications for this week
While the Sun-Mars-Venus conjunction is good reason to be bullish about the market to start 2026, it is much less clear what will happen this week. We remain within the effective range of two bearish alignments: the progressed Mercury-Saturn alignment (exact Dec 17) and the Mars-Neptune square (exact Dec 14). Our studies showed that bearish effects from these can last weeks after they are exact. While the effect sizes are relatively small and lack statistical significance, we should not be surprised if we see some volatility this week and perhaps even into next week, the final week of December. And yet since the bearish evidence is quite weak, we should also keep an open mind about the possible arrival of a Santa Claus rally.
Certainly with the bullish prospect of the Sun-Mars-Venus conjunction on Jan 9, bulls should be in a good position to withstand any short-term weakness. Even if there is some late December downside, the prospect of the January rally makes a stronger argument for buying any dips that may occur.
If you would like to receive these weekly posts as an email, please subscribe to my free Empirical Astrology newsletter on Substack.
Disclaimer: Not intended as investment advice. For educational purposes only
