

 (25 January 2026) US stocks ended the week slightly lower as Greenland-related tariff fears briefly shook market confidence. President Trump calmed the early week volatility, however, after announcing a face-saving deal with the EU which would apparently give the US greater access to Greenland. Despite all the geopolitical melodrama, stocks remain within 1% of their recent highs.
The pullback was not surprising given the Mercury-Mars-Saturn alignment on January 19-20. Our backtest of previous such alignments showed a modest but distinctly negative bias. Evidence suggested that the most bearish influence from this alignment occurred within a 24-day span that begins 12 days before the alignment and lasts until 12 days after. This 24-day period had an average decline of -1.5%, albeit with a very large standard deviation of 5%. This translates into a period from Jan 7 to Jan 31 and is represented as a red downward- sloping channel in the annotated DJIA price chart (see below).
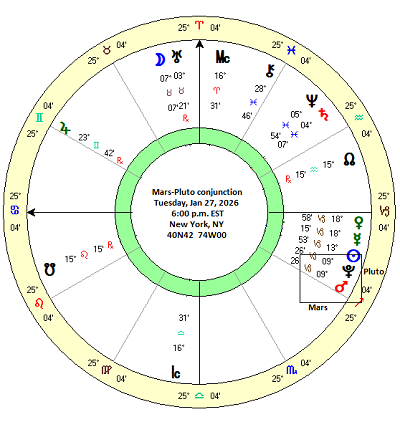
The Mercury-Mars-Saturn alignment of January 19-20 may well be amplifying the bearish influence of the Sun-Venus-Saturn alignment that was exact on January 15. These two influences are depicted by overlapping red-shaded channels in the DJIA price chart. Both are serving to undermine the ongoing bullish influence from the triple conjunction of Sun-Mars-Venus which was exact on January 9. But as these bearish alignments are now approaching the end of their most effective periods, it is possible that the market may soon be in a better position to rally once again. But we still need to take account of this week’s major alignment, that of the Mars-Pluto conjunction on Tuesday, January 27. Interestingly, this occurs just one day before the FOMC meeting…
To read the read of this post, please visit my Empirical Astrology Substack
