(31 May 2026) US stocks pushed higher yet again last week on AI-related earnings growth and hopes for new 60-day ceasefire deal with Iran. It was the ninth straight week of gains for the S&P 500 as the decline of crude oil below $90 underscored market expectations for an imminent agreement.
Last week’s gains were in keeping with our mostly bullish outlook. The Mars-Pluto square (May 25) and the larger alignment of Mars, Pluto and the North Lunar Node (Rahu) are largely positive influences based historical backtesting. Our studies showed that stocks generally moved higher with these alignments and some of the tested time intervals also reached statistical significance (p < 0.05).
The updated cumulative trend charts for May 29 reflect the bullish influence of these patterns. The market effect of the current Mars-Pluto square (red line) is tracking the historical mean and medians fairly closely. Based on a starting point 18 days before the exact alignment, as of May 28 (three days after the square alignment) the S&P 500 has risen 2.04%, which is just slightly more than the mean (1.78%) and median (1.74%). If past history is any guide, further upside is more likely than not for the two weeks following the May 25 square. Of course, we should always keep in mind the investing caveat: past performance is no guarantee of future results.
The market has also been mostly tracking the long-term average of larger alignment of Mars-90-Pluto-60-North Node. In its updated cumulative chart below, it has moved above the mean and median lines. Since the historical mean and median generally rise after the date of the exact alignment, we would also not be surprised to see further gains from here. At the same time, some mean reversion back down to the mean and median is also quite possible in the days ahead. Nonetheless, this bullish three-planet alignment is another reason why stocks have risen in recent weeks.
The Venus-Jupiter conjunction is another potential factor to consider. The updated chart below shows that is well above the long-term average of this conjunction. While this pairing has a bullish bias in the days leading up to its conjunction, the effect is quite small (around 1%) and none of the tested intervals produced statistically significance results. Thus, the Venus-Jupiter conjunction is actually a less bullish influence on the market than the Mars-Pluto square and Mars-Pluto-North Node alignment. Given the extent to which it is currently above its historical mean and median, some mean reversion lower would not be out of the ordinary.
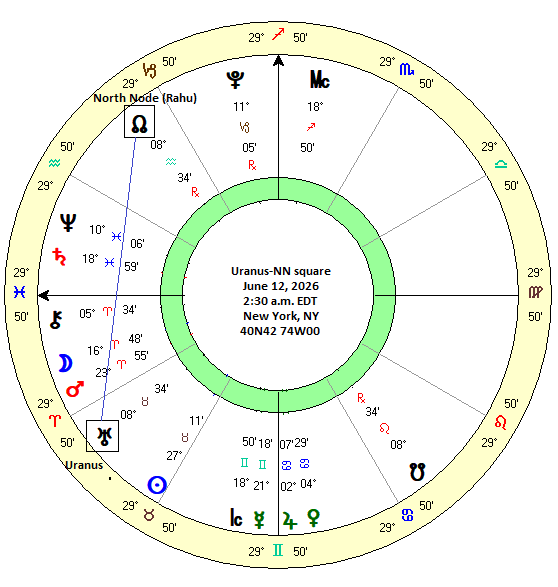
June 12: Uranus-90-North Node
Another upcoming alignment worthy of examination is the square alignment of Uranus and the North Lunar Node (aka Rahu). As both planets are relatively slow moving, their 90-degree square aspect occurs only every 7.5 years. Uranus takes about 84 years to complete its synodic cycle while the North Node follows a 18-year cycle. As a complicating factor, the North Node always moves backwards through the zodiac.
On the face of it, this pairing may carry a bearish connotation. Both planets are associated with disruption and sudden changes. Uranus connotes accelerated and unexpected change and is symbolically linked to innovation, technology and revolution. While and innovation and technology are usually positive factors, Uranus can sometimes manifest its energies in shocking and uncertain ways. As a result, its initial impact can be unsettling. Its market effects may therefore depend on its connections with other planets. If it is aligned with benefic planets like Jupiter, then that tends to be bullish while alignments with Saturn are more often bearish. Its square alignment with the North Lunar Node may fall somewhere in the middle of that spectrum.

The North Node is more amorphous in its meaning. In Western astrology, it is theorized in psychological terms and is said to represent areas of life requiring personal growth. In Vedic astrology, however, the North Node is known as Rahu — the Dragon’s Head — and is connected with notions of disruption of the status quo given its central role in eclipses. At the time of a solar eclipse, the lunar nodes conjoin the Sun and Moon as the light of the Sun is interrupted by the transit of the Moon. In this sense, the North Node’s theme of disruption and change echoes similar notions in the symbolism of Uranus. In Vedic astrology, the North Node/Rahu is also associated with ambition and acquisitiveness. For this reason, it is also seen as an amplifier, for good or ill, depending on the other planets it is associated with. While Uranus is considered a neutral influence, the North Node/Rahu is more often regarded as a natural malefic in traditional astrology.
Given the dynamic symbolism of both planets, it would not be unreasonable to think this combination could bring an increase in market volatility. But as always, let’s look at the data first before we reach any conclusions.
Method
The table below shows the DJIA closing prices for the Uranus-North Node square alignments from 1896 to 2026. In order to determine its potential influence, prices were recorded at 5-day intervals, starting at 40 days before the alignment and ending at 40 days after. These start and stop points are somewhat arbitrary but hopefully the 80-day time window is long enough to see if there is any effect on stock prices. If this alignment is bearish, then we should be able to see a pattern of price declines across most of the cases, even if there are individual outliers due to simultaneous alignments with other planets. The total sample size is just 18 cases — probably too small to reach statistical significance but perhaps large enough to discern any patterns in the data.
The summary statistics table below analyzes the price changes across various intervals. The first column (“-40d 40d”) shows the price change during the longest interval of 80 days. Based on a 5.5% average annual return for 1896-2018, the benchmark expected average is 1.21%. As we can see, both the mean (3.22%) and median (3.05%) for this interval greatly exceeded its long term average. Far from being a bearish alignment, this one actually looks quite bullish. However, the high standard deviation of 8.55% highlights a wide distribution of outcomes. Some cases were very bullish (1972, 1980) but some were very bearish (1957, 2018). With a p-value of 0.346, this result did not achieve statistical significance (p < 0.05).
Most other intervals were similarly bullish, although not bullish enough to reach significance. All intervals posted more than 50% positive outcomes, although none exceeded 71%. Both the period before the square and after the square were more or less equally bullish. For example, the 20-day period before the square (“-20d 0d”) had a mean of 0.97% which was more than three times the benchmark of 0.30%. This was basically on par with the 20-day period after the square (“0d 20d”) with its mean of 1.18%.
The shorter 5-day intervals around the time of the exact square were more neutral, however. This was perhaps a reflection of the slower speed of both planets which meant any effects were not closely tied to the exact alignment. Instead, price effects only became apparent after zooming out to the 10-day or 20-day intervals.
The cumulative trend chart below reveals the mostly bullish effect of the Uranus-North Node square. While all of the 80-day look back period is above the benchmark line, it is the period towards the end of the look back period that is most bullish. For the current alignment that comes exact on June 12, this suggests that the most positive period may extend well into the month of July. For now, the current alignment (red line) is tracking well above the long term averages. Therefore, some mean reversion back down to mean and median lines would not be surprising in the coming days. But the overall trend is still mostly up.
Implications for this week
Our study suggests the Uranus-North Node square is yet another bullish influence on the stock market. Since its potential effects may have started to manifest in early May (i.e. 40 days before the June 12 alignment), we are already within its time of influence. However, since its effects are quite diffuse across a fairly long time period and carry a large variability, we may not necessarily feel its impact this week. In other words, even a down week this week would not be incommensurate with the overall bullish effects of the Uranus-North Node square.
On the other hand, the ongoing bullish effects of the Mars-Pluto and Mars-Pluto-North Node alignments are still very much in play this week. Their influence will help to support stock prices and may limit the extent and duration of any potential downside. And the Venus-Jupiter conjunction on June 9 may also exert a modest bullish influence on markets this week as the pairing enters its most bullish phase 9 days before its exact conjunction (“-9d 0d”).
While the immediate effect of these bullish alignments is unknowable in terms of this week’s market outcomes, they do suggest that any dips will continue to be bought as this powerful spring rally is likely to extend into June.

Disclaimer: Not intended as investment advice. For educational purposes only.


