

 (25 January 2026) US stocks ended the week slightly lower as Greenland-related tariff fears briefly shook market confidence. President Trump calmed the early week volatility, however, after announcing a face-saving deal with the EU which would apparently give the US greater access to Greenland. Despite all the geopolitical melodrama, stocks remain within 1% of their recent highs.
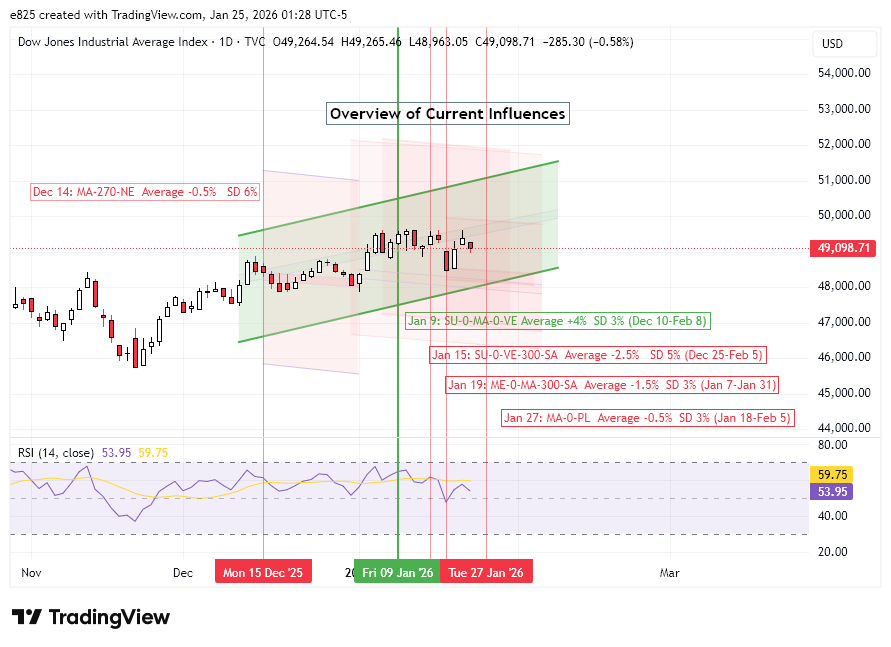
The pullback was not surprising given the Mercury-Mars-Saturn alignment on January 19-20. Our backtest of previous such alignments showed a modest but distinctly negative bias. Evidence suggested that the most bearish influence from this alignment occurred within a 24-day span that begins 12 days before the alignment and lasts until 12 days after. This 24-day period had an average decline of -1.5%, albeit with a very large standard deviation of 5%. This translates into a period from Jan 7 to Jan 31 and is represented as a red downward- sloping channel in the annotated DJIA price chart (see below).
The Mercury-Mars-Saturn alignment of January 19-20 may well be amplifying the bearish influence of the Sun-Venus-Saturn alignment that was exact on January 15. These two influences are depicted by overlapping red-shaded channels in the DJIA price chart. Both are serving to undermine the ongoing bullish influence from the triple conjunction of Sun-Mars-Venus which was exact on January 9. But as these bearish alignments are now approaching the end of their most effective periods, it is possible that the market may soon be in a better position to rally once again. But we still need to take account of this week’s major alignment, that of the Mars-Pluto conjunction on Tuesday, January 27. Interestingly, this occurs just one day before the FOMC meeting.
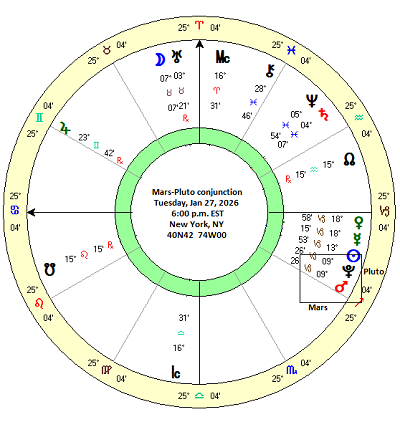
The Mars-Pluto conjunction
To gain a full understanding of its potential market impact, this week’s Mars-Pluto conjunction requires a proper statistical analysis. On the price chart, this is rendered as MA-0-PL to show that there are now 0 degrees separating the two planets. As I mentioned last week, I suspected this had some bearish potential given the traditional assumptions about malefic Mars when in conjunction with outer planets such as Pluto. But rather than relying on intuitive guesses, let’s dig into the data and see what the evidence says.
The table below shows the closing prices of the Dow Jones Industrial Average (DJIA) at 3-day intervals before and after previous Mars-Pluto conjunctions from 1951 to 2026. The Mars-Pluto conjunction occurs about once every two years, although Mars’ occasional retrograde cycles can mean that some years will feature two or three conjunctions with Pluto. The first column is marked “-24d” and it is the price of the DJIA 24 days before the exact conjunction. Each column then represents the price 3 days later (“-21d”, “-18d”, etc.) until “0d” which is the price on the day of the conjunction. Prices were also recorded at 3-day intervals after the conjunction with the final price recorded 24 days after the conjunction.
While there is a large variation in outcomes, it is worth noting that the Mars-Pluto conjunction on March 23, 2020 occurred just one day before the interim low during the Covid crash. Given the huge 25% decline in the preceding three weeks and subsequent fast recovery, this negatively skewed the average. For this reason, the median should assume a somewhat greater importance in evaluating the data.
The summary statistics table below analyzes the price changes across various intervals. The first column (“-24d 24d”) records the price change across a 48-day window. As expected the average (-0.11%) is significantly lower than the median (0.75%) and reflects some outsized declines such as in March 2020. While the p-value does not reach the threshold of statistical significance (p<0.05) is actually comes fairly close at 0.143. The median is not far from the benchmark of 0.92% and suggests that this longer price window is pretty neutral. The benchmark figure is based on an average annual return of 7% for the Dow for the years 1951 to 2024.
Other intervals were more negative, however. The “-12d 12d” interval posted negative results for both average (-0.68%) and median (-0.43%) and came very close to reaching significance with a p-value of 0.089. Also only 16 out of 41 previous conjunctions were positive during this intervals indicating a clear vulnerability to declines. But with a standard deviation of 4.19%, the data is very widely distributed and hence less reliably bearish for any single case. This reduces the predictive confidence of this conjunction since the standard deviation greatly exceeds the average price change. Nonetheless, the bearish bias in the data is noteworthy. For the current conjunction, this would equate to a bearish influence from Jan 15 to Feb 8.
The 18-day window (“-9d 9d”) also came close to reaching statistical significance (p = 0.085) and had a comparable average of -0.54% and median of -0.52%. This would equate to Jan 18 to Feb 5. The only interval that was statistically significant was the short, 3-day window immediately before the conjunction (“-3d 0d”). Although significant, the average decline was only -0.31% with a median decline of -0.29%. And with 16 out of 41 cases actually positive, this should not be considered a high probability bearish influence. This would equate to Jan 24 to Jan 27 with the current conjunction.
The cumulative trend chart below illustrates the modest bearish bias of this conjunction. This trend chart compares prices over time with the starting point of 24 days before the conjunction. Both the average and median lines dip below the benchmark line around the time of the exact conjunction and remain below it for at least two weeks. We should note, however, that the median is never negative with respect to the initial price 24 days prior to the conjunction. This offers more evidence of a very modest bearish effect. But since the current line (in red) has so far been tracking well above the long term average and median, it is not unreasonable to expect some mean reversion could take the line closer to zero in the coming days. This would imply some downside may be more forthcoming now.
Implications for this week
Even if Tuesday’s Mars-Pluto conjunctions is a limited bearish influence, its proximity to the FOMC meeting the next day is a warning of possible volatility. The conjunction increases the likelihood of some downside in the first half of the week, especially since we will still be within effective range of the aforementioned two Saturn alignments — Mercury-Mars-Saturn and Sun-Venus-Saturn. If stocks manage to stay positive before Wednesday’s FOMC, a negative reaction is still more likely than not since it falls within the effect range of some of the more bearish intervals in the study.
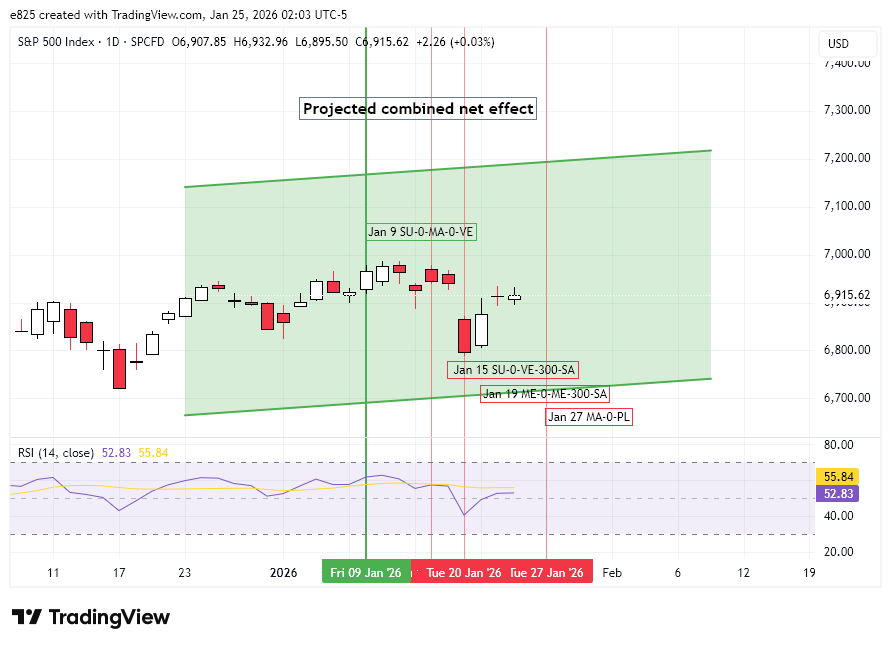
In the event of some selling this week, the downside could be fairly limited given the stronger bullish effect of the Sun-Mars-Venus conjunction. This is one major reason why I would expect the rising green channel in the SPX chart below to remain intact for the near future. A brief dip below its lower bound is still possible, of course, but a sustained breakdown seems unlikely given the ongoing impact of the bullish triple conjunction.
Disclaimer: Not intended as investment advice. For educational purposes only.
If you would like to receive this post as an email, please subscribe to my free Substack newsletter, Empirical Astrology.
