

 (18 February 2026) Synopsis: Thursday’s “hidden” Jupiter-Saturn alignment introduces some downside risk to the market over the next week or two. Evidence from previous 105-degree Jupiter-Saturn aspects suggests a bearish bias in its aftermath, although none of the intervals tested quite reached statistical significance. Combined with next week’s Mercury Rx-Venus conjunction, a pullback of indeterminate size becomes more likely over the next two to three weeks.
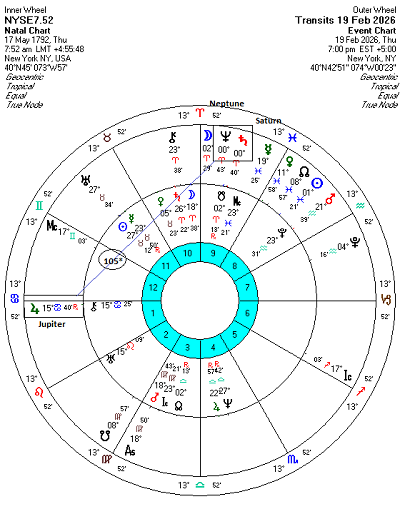
Sunday’s newsletter focused mainly on the upcoming Saturn-Neptune conjunction on Friday, Feb 20. And yet upon closer inspection, I realized this was no ordinary conjunction. That is because at the time of the conjunction, Saturn and Neptune will also form a simultaneous aspect with Jupiter. That is quite unusual. The only previous time this occurred in the past 120 years was in August 2025, and the Saturn-Neptune conjunction then was not as close as the current one is. I initially did not pay too much attention to this Jupiter aspect since it was a seemingly lesser 105-degree aspect. In fact, it is so rarely used it doesn’t even have a name.
And yet it is potentially important since 105 degrees is based on the divisors of the circle. But rather than being a multiple of 30 degrees as is usually the case, it is a multiple of 15 degrees and there are 24 such segments in a circle. There are two aspects based on 15 degrees that are more commonly used in Western astrology: the 45-degree semisquare and 135-degree sesquisquare aspects. But due to its geometric importance in defining the circle, other aspects that are multiples of 15 degrees may also be significant. I would also note that the 105-degree aspect between Jupiter and Saturn becomes a conjunction in the 24th harmonic chart (aka the D-24 Chaturvimsamsa in Vedic astrology).
Another interesting thing about the 105-degree aspect is that it lies in close proximity to two other aspects: the 102.8-degree bi-septile (2 x 51.4) and the 108 degree tridecile (3 x 36). The bi-septile aspect is based on the division of the circle into seven equal parts and the tridecile is based on the division of the circle into 10 equal parts. Thus the septile and biseptile aspects in the natal chart become a conjunction in the 7th harmonic chart (aka the D-7 Saptamsa chart in Vedic astrology) and a conjunction in the 10th harmonic chart (the D-10 dasamsa chart in Vedic astrology). The close proximity of these other two aspects could therefore shape the influence of the 105-degree aspect as the two planets move through their respective forward and retrograde cycles before and after this alignment.
Jupiter-105-Saturn: February 19, 2026
Which brings us to this Thursday’s 105-degree aspect between Jupiter and Saturn and Jupiter and Neptune. While this aspect is exact one day before Friday’s Saturn-Neptune conjunction, the relatively low velocity of these planets means that Saturn will be just three arc minutes away from Neptune on Thursday, Feb 19. In other words, this is a very tight alignment of three planets. For the purposes of this post, I will restrict my analysis to just the Jupiter-Saturn alignment. The table below gives closing prices on the Dow Jones Industrial Averages (DJIA) at various intervals before and after the alignment. From 1906 to 2025, I recorded 20 cases in which Jupiter was separated by 105 degrees from Saturn, by standard counterclockwise reckoning.
The table lists prices at 30 days before the alignment (“”-30d”), 25 days before the alignment (“-25d”) and so on until 30 days after the alignment (“30d”). Following the normal synodic cycle of Jupiter and Saturn, this alignment occurs once every 20 years. However, due to the retrograde cycles of both planets, the alignment occurs three times in each transit series. These have been numbered in the third column. Both planets’ directions (direct or retrograde) have been recorded in the fourth column.
The summary statistics table below shows the price changes across various intervals. The first thing we notice is that none of the intervals tested produced statistically significant results, although a few interval came close with p-values near 0.10 (i.e. a 90% probability that the results are not due to chance). But the main takeaway from this table is that the period before the alignment tends to be bullish whereas the period after the alignment is usually bearish. We can see this pattern for all the intervals after the alignment (e.g “0d 20d”). While the period after the exact alignment leans bearish, the average move is fairly small — about -1% for the longer 15- or 20-day intervals. Nonetheless, the consistency of the pattern suggests this could act to undermine sentiment in the period after the Feb 19 alignment. It could even offset the otherwise bullish bias of the Feb 20 Saturn-Neptune conjunction as discussed in Sunday’s post.
Disaggregation: 2nd transit only of the JU-105-SA series
As we have discovered through examining other alignment sequences, not every transit in the 3-transit sequence produces similar results. Due to retrograde motion or some other unknown factor, the 1st, 2nd and 3rd transits for an alignment may each exhibit unique results. For the current alignment, we note that this will be the 2nd alignment of the 3-transit series and Jupiter will be retrograde. In order to more closely simulate the characteristics of the current Jupiter-Saturn alignment, we can examine other 2nd transits to see what effects they may produce.
The summary statistics table below shows all 2nd transit price changes when Jupiter is 105 degrees away from Saturn. Unfortunately, the resulting sample is tiny — just 6 cases. Such a small sample is unlikely to generate much data, although we can perhaps take a more impressionistic approach to data interpretation. Like the larger sample (n=20) that includes all three transits, no interval reached statistical significance. That reduces the reliability of this data for making predictions. However, we see the same pattern bullish before the 105-degree alignment and bearish afterwards. Not only that, we can see that the size of the declines after the alignment is larger in this more specific sample, more on the order to 2.00% to 2.50%. It is therefore possible to see the aftermath of Thursday’s alignment as a bit more bearish, even if the small sample size rules out any high confidence predictions.
The cumulative chart below illustrates this bullish before/bearish after pattern. While it’s a choppy chart, both the average and median lines generally rise into the “0d” of the alignment (Feb 19 for our current alignment) and then fall off sharply thereafter. Based on the light blue average line, it is possible that the peak may occur several days before the exact alignment. Even with a small sample caveat, it does offer evidence for some downside in the 10-15 days following the Feb 19 alignment.
Implications for this week
Given the modest bearish bias of the Jupiter-105-Saturn aspect, some downside seems more likely this week, especially later in the week. Next week also could see increased downside risk since the negative effects of the alignment appear to extend about 10-15 days after the fact. This would take us to the first week of March. It is still possible that US stocks could have a positive week overall, however, but that doesn’t seem probable.
I would also note the approach of next week’s Mercury retrograde station on Thursday, Feb 26. Evidence suggests this may only be slightly bearish on average although we should pay attention to where it is turning retrograde — at 28 Aquarius/22 Pisces. This is exactly opposite the natal Mars in the NYSE natal chart if using the precession-corrected sidereal zodiac. Mercury-Mars aspects tend to be market negative and the fact that Mercury will station and reverse its direction at that point could amplify the negativity.
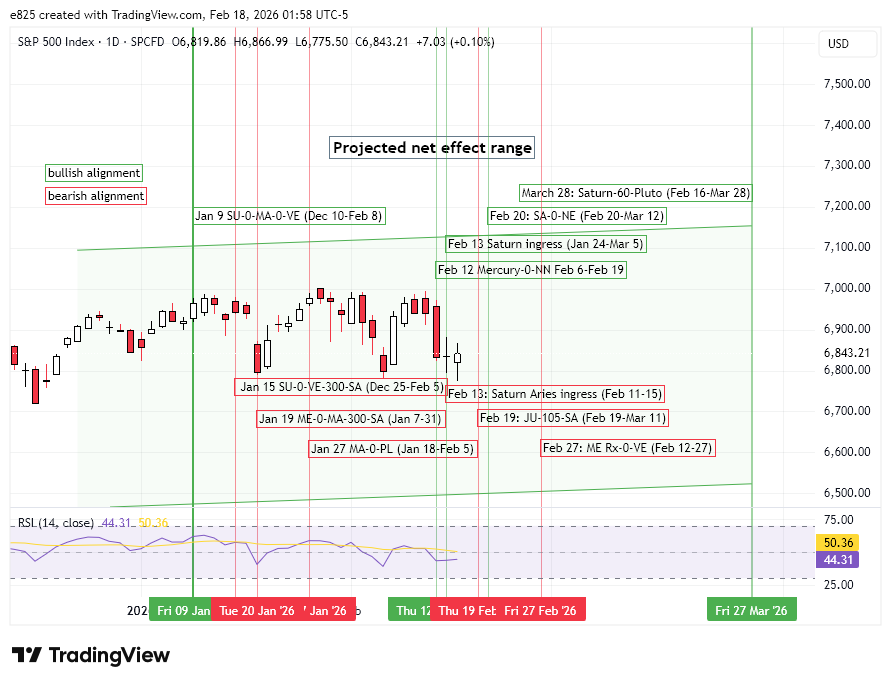
The other thing to note is that retrograde Mercury will conjoin Venus on Friday, Feb 27. Our study of this conjunction demonstrated a clear bearish bias when retrograde Mercury conjoined Venus. The bearish bias was largely concentrated in the 15 days prior to the conjunction, although the effect was fairly small at -1.35%. This creates a negative influence for the period Feb 12 to 27. I have added these two influences to the annotated DJIA and SPX charts. In light of the potentially bearish influence of these alignments, I have lowered both the top and bottom of the rising SPX channel in the Projected net effect range chart.

The combined effect of these two alignments could weigh on sentiment for the near term. It may not preclude further upside in March, but it means the market may have to travel a crooked path to get there.
Disclaimer: Not intended as investment advice. For educational purposes only.
If you would like to receive these posts in an email, please subscribe to my free Substack newsletter, Empirical Astrology
