

![]() (15 February 2026) Stocks generally moved lower last week on growing fears that AI disruption could undermine profitability in several economic sectors. While technology shares once again led the decline, the broader market indexes like the NYSE Composite actually ended the week higher.
(15 February 2026) Stocks generally moved lower last week on growing fears that AI disruption could undermine profitability in several economic sectors. While technology shares once again led the decline, the broader market indexes like the NYSE Composite actually ended the week higher.
The pullback coincided closely with the ingress of Saturn into tropical Aries on Friday, Feb 13. Indeed, Thursday’s sell-off occurred just one day before Saturn changed signs — a fairly strong correlation as these things go. While I thought we would see some downside last week with the Saturn ingress, I was unsure to what extent it might be offset by the bullish influence of the conjunction of Mercury and the North Lunar Node on Feb 12.
The updated cumulative trend chart below shows how last week’s decline fits neatly with the negative bias of previous ingresses. If past performance is any indication, then stocks should soon follow the average and median lines and move higher. The average bottoms out at “2d” or 2 days after the ingress. This equates to Feb 15 in our current transit set up. Since this falls on a weekend, we should assume that the after effects of the Saturn ingress will offer a bullish bias this week, notwithstanding other alignments.
Our backtest of the Mercury-North Node conjunction showed a clear bullish bias from 6 days before to 6 days after — Feb 6 to Feb 18 in the current transit. While the Saturn ingress was likely to coincide with some down days, it remains to be seen if this Mercury-NN conjunction will assert its bullish influence this week upcoming. Statistically speaking, it is now more likely, at least by the end of its bullish interval on Feb 18. As the updated cumulative trend chart below suggests, last week’s pullback may also be seen in terms of mean reversion as the the DJIA returned to its average and median lines. While further downside is always possible, the data have a bullish bias going forward until the end of the test period 18 days after the conjunction (i.e. March 2).
The Saturn-Neptune conjunction
Our research focus this week will be on Friday’s Saturn-Neptune conjunction (Feb 20). Due to the low velocity of these distant planets, this is a rare conjunction that only occurs once every 35-37 years. The last one took place in 1989 and famously coincided with the fall of the Berlin Wall. On the face of it, the Saturn-Neptune conjunction would seem to hold some risk for market sentiment. Saturn is a natural malefic, while Neptune is traditionally seen in neutral terms as it modifies its nature depending on the planet it is associated with. Saturn-Neptune aspects are therefore regarded with some caution in financial astrology. But does the data from previous conjunctions support this cautious view?
At the outset, we once again have to contend with the problem of a small sample size. Since the launch of the Dow Jones Industrial Average in 1896, there has only been three Saturn-Neptune conjunctions — in 1917, 1953 and 1989. Due to the back-and-forth of their respective retrograde periods, this number expands to a total of 8 conjunctions during those three years. It would seem that this sample size is not big enough to make any reliable predictions about the upcoming conjunction. But we should nonetheless examine the before and after of the conjunction just in case there are any glaring correlations.
The table below shows the closing prices at various intervals for the Saturn-Neptune conjunction. The first column is labeled “-90d” and refers to the price of the DJIA 90 days before the conjunction. “-60d” is the price 60 days before the conjunction and so on until the last column labeled “90d” which is the price 90 days after the conjunction. If this conjunction is bearish as some might hypothesize, there should be a negative pattern in these prices.
The summary statistics table below lists the average, median and benchmarks for each interval. The first column (“-90d 90d”) is a very long 180-day interval. Based on the benchmark of 5.9% average annual return, we can see that there is no clear trend in prices before or after this conjunction. With the benchmark at 2.90%, the average at 3.72% is modestly above it but the median is 1.26% and falls quite a bit below it. And with a massive standard deviation of 12.53% and a high p-value of 0.858, there is clearly no discernible pattern in the data. Indeed, none of the intervals have statistically significant results (p<0.05) and all have fairly modest outcomes relative to the benchmark figure.
Expanding the sample size
So what to do? We need to expand the sample size to include other alignments of Saturn and Neptune. While these will include different angular alignments, they will still provide some evidence of the market effects when Saturn combines with Neptune. To achieve this, I decided to include the other “hard” aspects in order to have a more workable sample size of 41 cases. In Western astrology, the hard aspects are the conjunction, square (90 degrees) and opposition (180 degrees) while the “soft” aspects are the sextile (60 degrees) and the trine (120 degrees). Western midpoint theory actually holds the hard aspects to be the most important alignments between planets and are seen as primary aspects. While this could be debated, in the interests of brevity I nonetheless limited the sample to those three aspects.
The table below shows the closing prices for the 41 conjunctions, squares and oppositions from 1899 to 2025. Due to the low velocity of Saturn and Neptune, the intervals are of varying lengths. Some are 30 days apart while others are 10 days apart. In using shorter 10-day intervals closer to the exact aspect date, I wanted to see if there were any strong correlations just before or after the alignment.
The summary statistics table below presents the results of this study. The first column (-90d 90d) suggests a bullish bias as both average (5.75%) and median (5.26%) are well above the benchmark at 2.90%. However, the result was not significant although it came close with a p-value of 0.091. (i.e. there was a 90.9% probability that the result was not due to chance). And yet with a standard deviation over 10%, we should be cautious about reading too much into this result. The data have a very wide distribution and thus predictions about the current Saturn-Neptune alignment are more problematic.
While many intervals produced net positive results relative to the long term benchmark, there is only one interval that produced a statistically significant result: “0d 20d”, that is the period from the day of the exact alignment (0d) to 20 days after the alignment. Even then, the average gain was fairly modest at 1.62%. Far from being a bearish combination, the hard Saturn-Neptune aspects are somewhat bullish, especially during the period after their exact alignments.
This is also seen in the cumulative trend chart below. Both the average and median lines track above the benchmark line for the duration of the 180 days, although there is a slight dip around the time of the exact alignment. However, this dip is not large enough to forecast a similar dip this week as we approach the exact conjunction on Friday, Feb 20. The data suggests it’s possible, but not probable. As it happens, the current line in red is tracking far above the average and median. This could indicate potential downside risk at some point if there is some mean reversion to those blue lines.
Implications for this week
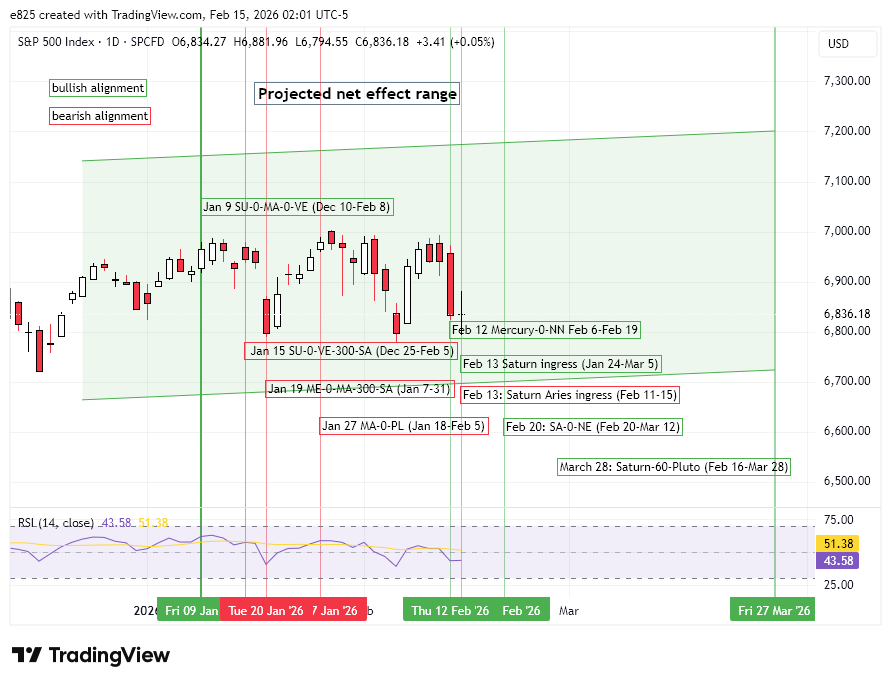
The combined effects of the Saturn ingress into Aries and the Mercury-North Node conjunction may well be enough to take stocks higher this week. That is far from certain, however, as the effect sizes are fairly small and could be offset by other unknown influences. But with Friday’s Saturn-Neptune conjunction, there will be an additional bullish influence starting next week which will serve to further support prices and perhaps fuel another higher high. However, that influence will only begin after Friday, Feb 20.
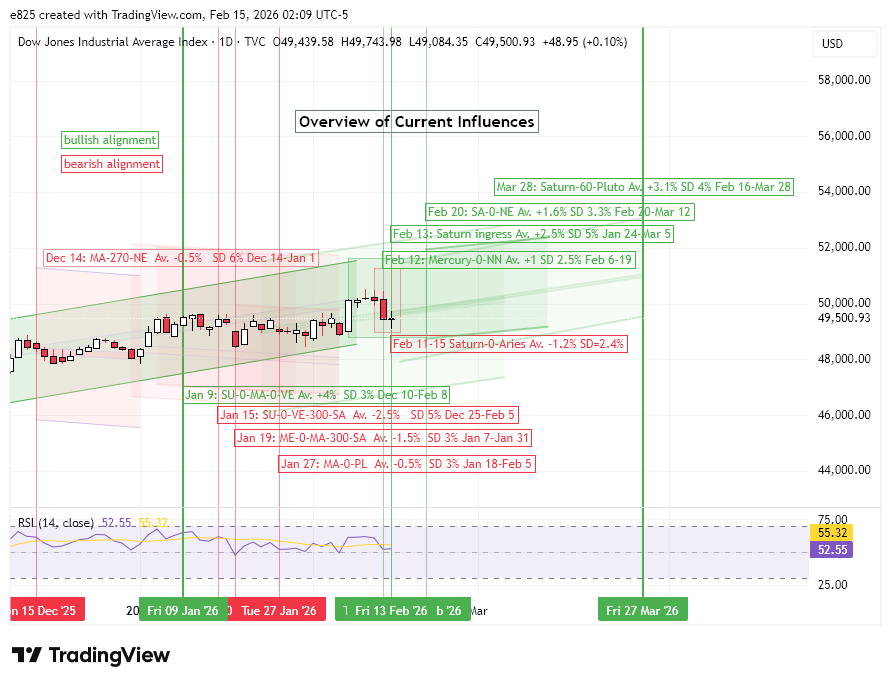
Looking further ahead, we should make special mention of the approaching 60-degree sextile alignment of Saturn and Pluto on March 28. I’ve done some preliminary research on this pairing and it may well be another tailwind for markets, at least up to the time of the exact alignment in late March. Based on previous Saturn-Pluto alignments, there is an average 3% gain over the 40-day period that precedes its sextile alignment. I have added it to the annotated charts of the DJIA and the SPX. But more on that next week.
Disclaimer: Not intended as investment advice. For educational purposes only.
