

 (5 April 2026) Stocks rebounded last week on hopes that a ceasefire in Iran would lead to an eventual re-opening of the Strait of Hormuz. While stocks rallied on war optimism, US oil prices actually pushed back above $100 as supply fears began to take hold.
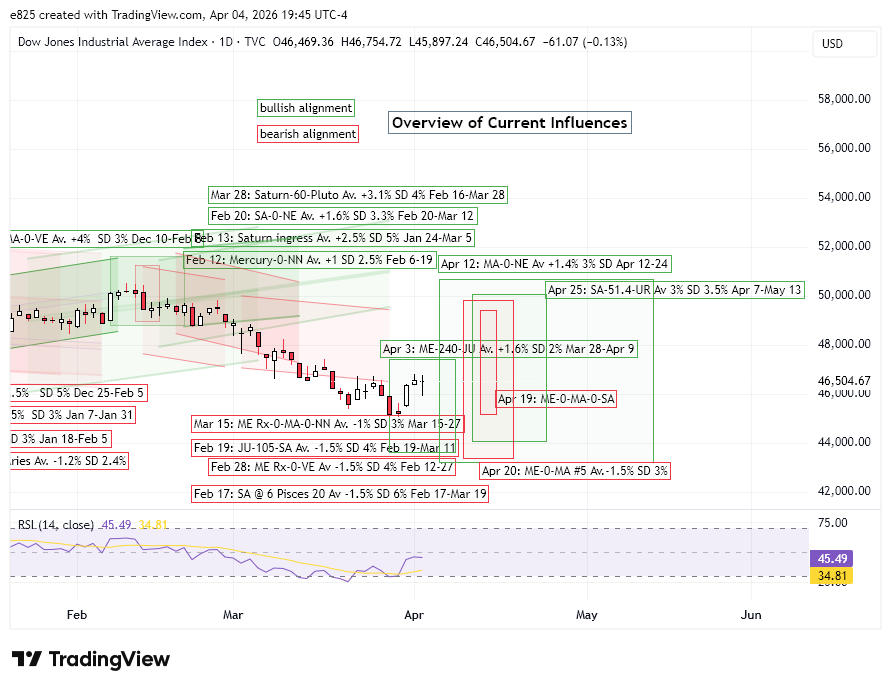
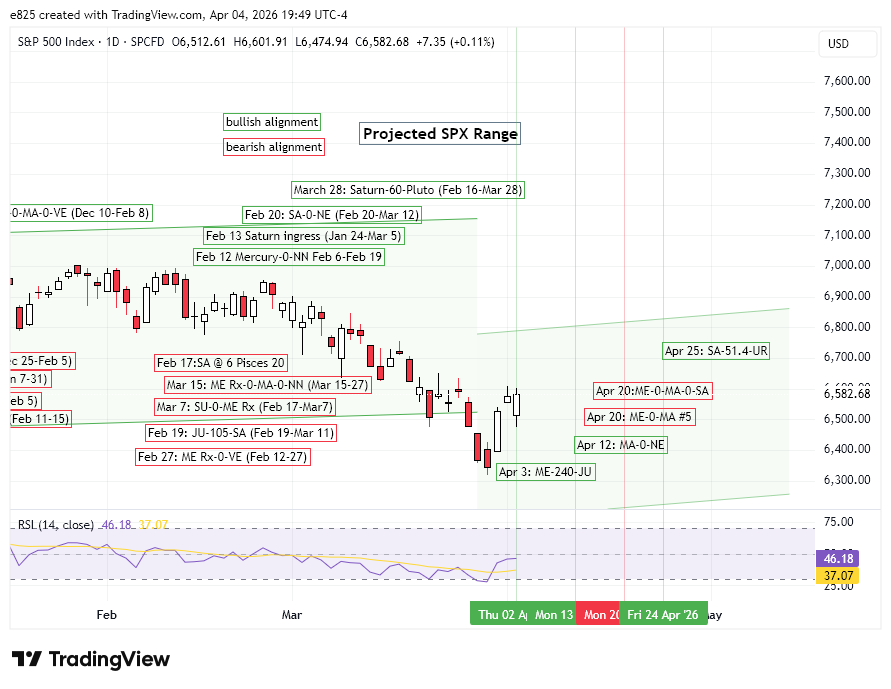
The rally was basically in line with expectations as the gains coincided closely with the Mercury-Jupiter trine aspect. Our backtest of previous alignments suggested a bullish bias when both Mercury and Jupiter were direct, especially given the probable waning negative impact of the March 15 Mercury-0-Mars-0-North Node conjunction. Last week’s rally appears in both cumulative trend charts as the red current alignment line appears to be reverting to the long term averages of both planetary patterns. While there is no guarantee that either red line will rejoin their average and median lines, it nonetheless is some evidence for further upside in the coming days.
However, the upcoming four-planet conjunction of Mercury, Mars, Neptune and Saturn on April 12-20 may bring another bout of volatility. Last week we discussed how previous three-planet Mercury-Mars-Saturn conjunctions had very disparate outcomes with no clear bias one way or the other. A mixed or choppy market outcome was arguably more likely absent any additional alignments involving Jupiter or Saturn as is the case this time around.
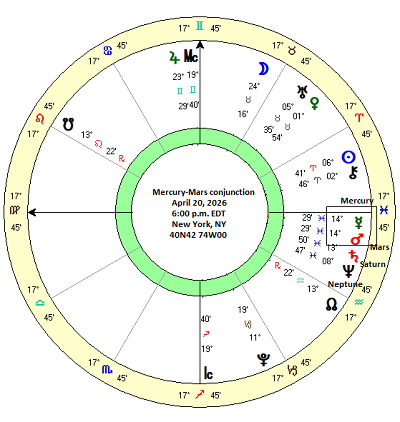
April 20: The fifth Mercury-Mars conjunction
And yet is still some reason for caution as Mercury will conjoin Mars on April 20. Like the Mars-Saturn conjunction, this is one of the constituent components of this larger four-planet mid-April conjunction. As it happens, the upcoming Mercury-Mars conjunction will be the fifth and final conjunction in its current series of conjunctions between these two planets which began in October 2025. Due to the periodic retrograde motion of Mercury, Mercury-Mars conjunctions occur multiple times every two years. Usually, there is a cluster of three conjunctions within a shorter three-month period and then the faster-moving Mercury separates from Mars until it catches up two years later and initiates a new cluster of conjunctions.
However, sometimes Mercury and Mars conjoin five times over a six-month period. This five-conjunction sequence of Mercury and Mars happens about every 15 years. The last five-conjunction sequence occurred in 2011. Actually, these five-conjunction sequences usually occur in pairs about two years apart. The second sequence is followed by a 15-year gap before the next paired conjunction sequence. Thus, the last pair of five-conjunctions occurred in 2008-2009 and 2011. Before that this special conjunction sequence occurred in 1993-1994 and 1996, and before that in 1977 and 1979 and so on.
Astrologer Chris Brennan has noted the significance of this unusual five-conjunction Mercury-Mars sequence and how it often coincides with periods of crisis and uncertainty. For example, the Wall St. crash of 1929 and subsequent economic depression occurred during a pair of these five-conjunction sequences. The first sequence extended from Sep 1929 to Mar 1930 and the second sequence occurred Nov 1931 to May 1932. The Global Financial Crisis of 2008-2009 also coincided with a five-conjunction sequence from Sep 2008 to Mar 2009. The second paired sequence in 2011 was less eventful, however. Amazingly, the Iranian Revolution of Feb 1979 also took place during a five-conjunction cluster from Nov 1978 to May 1979. The first cluster in 1976-1977 was less historically significant.
These five-conjunction sequences don’t always produce major historical events but they often do. The fact that the US/Israel war with Iran has broken out during another five-conjunction sequence is even more evidence of its importance. But its market effects deserve closer examination.
Our previous backtest studies of all Mercury-Mars conjunctions regardless of numbered sequence suggested a fairly neutral market effect, although there effect became bearish when Mercury was retrograde. We observed this first-hand when Mercury retrograde conjoined Mars on March 15 as the market declined before and after the conjunction.
But that was outside of any consideration of this longer six-month sequence of conjunctions. In order to better estimate the effect of the upcoming April 20 conjunction, we need to place it in the context of these unusual five-conjunction sequences. Since the April 20 conjunction will be the fifth and final conjunction in the sequence, we can create a sample comprised only of other fifth conjunctions of Mercury and Mars. And we should note off the top that Mercury is always in direct motion at the time of the fifth conjunction.
The resulting sample is quite small, however, with just 15 cases. Nonetheless, its specific parameters closely match the current conjunction and thus could provide useful insights about market direction in the coming weeks. The table below shows the closing prices of the DJIA at various intervals before and after the fifth conjunction from 1898 to 2011.
The summary statistics table below provides an overview of the price changes across various intervals. The results are clearly bearish. While no interval reached statistical significance, all intervals except one had a net bearish lean. The first column (“-15d 15d”) shows a -2.20% average price decline during a 30-day window that began 15 days before the conjunction and ended 15 days after. This would equate to a period from April 5 to May 5 for the current conjunction.
The period before the conjunction seems more bearish than the period after as most intervals register larger average and median declines in the approach to the conjunction. The interval with the lowest p-value and thus greatest potential effect is the 9-day period before the conjunction (“-9d 0d”). This produced an average return of -1.56% and equates to April 9 to April 20 for the current conjunction.
While the period before the conjunction looks more bearish, the cumulative trend chart below suggests the period after the conjunction also has a negative bias, although it may be somewhat less. The close tracking of both the average and median lines until 6 or 9 days after the conjunction is confirmation of the bearish bias to this conjunction.
The fact that the median line also tracks well below the benchmark is evidence that the bearish effect of the sample is not an artifact of just two outsized declines in 1932 and 2009. Even if those two conjunctions coincided with large declines, other conjunctions were also bearish and suggested that the fifth conjunction itself carries a bearish bias, above and beyond any other simultaneous alignment.
From this study, the fifth Mercury-Mars conjunction clearly has a bearish impact on sentiment. While a net decline of just -1.5% or -2% by itself may not be enough to produce a lower low in stocks or even a retest of the March 30 low at SPX 6316, it is evidence for continued volatility in the market. It also argues against a V-shaped recovery and significant gains in the month of April.
Implications for this week
As we enter the 15-day active period ahead of the fifth Mercury-Mars conjunction(on April 5 — and also the quadruple Mercury-Mars-Neptune-Saturn conjunction — there is good reason to be cautious this week. And yet the bullish influence of the Mercury-Jupiter trine may not be quite done yet. Our backtest of its previous alignments suggested its effects can often linger 6 or 8 days after the conjunction which occurred on April 3. This is far from guaranteed, however, as the average effects are quite small and somewhat inconsistent.
A safer assumption is for a choppy week in which the market seeks direction. No doubt the news flow out of Iran and the White House will continue to move markets. But the approach of this fifth and final Mercury-Mars conjunction gives the bears the benefit of the doubt in the short term. For now, the market should be seen as guilty until proven innocent.
Disclaimer: Not intended as investment advice. For educational purposes only
