

 (9 April 2026) Stocks stayed in rally mode on Thursday with a strong follow-through after Wednesday’s ceasefire surge. The scale of recent gains since the March 30 low has investors wondering if the market is now in the clear.
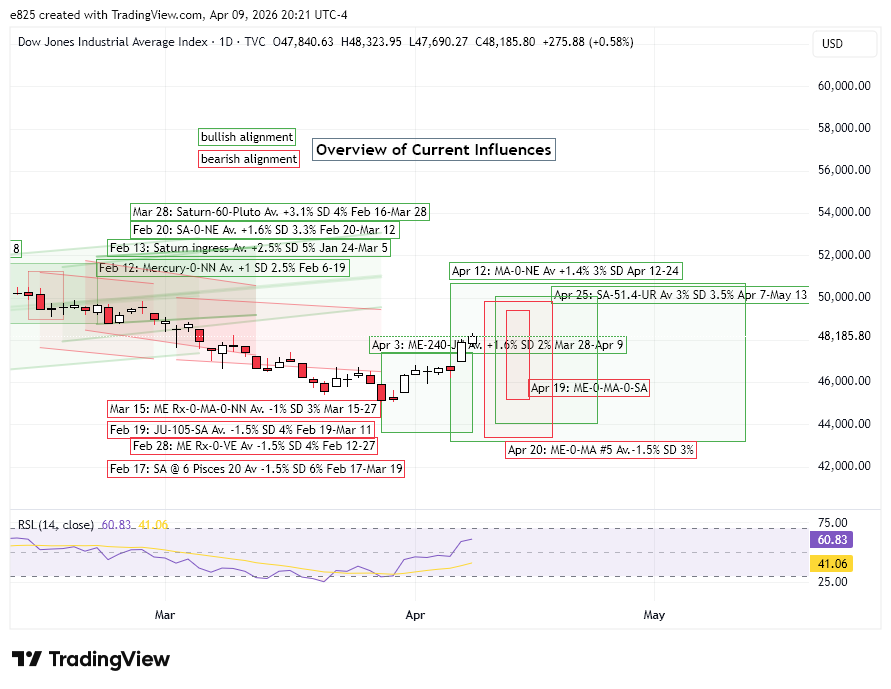
This rally has closely coincided with the Mercury-Jupiter trine. Our backtest study suggested this was a statistically significant bullish influence which could be a positive influence for stocks from March 28 to April 11. This time interval closely tracks the rally since the March 30 low which has seen the indexes rise for seven straight trading days. While the average gain in the study was only about 1.5% and the rally off the low has been about 7%, this alignment is nonetheless is part of the story behind the rebound.
The updated cumulative trend chart for the Mercury-240-Jupiter alignment shows that the current alignment has now moved above the already bullish average and median lines. It could continue to go higher, of course, but some mean reversion in the coming days would not be surprising.
And some mean reversion would certainly be in keeping with the bearish potential of the 5th Mercury-Mars conjunction that we discussed in Sunday’s newsletter. This is usually a bearish alignment which has delivered negative market outcomes about 80% of the time during the 9 days leading up to its conjunction on April 20. This 9-day interval before the conjunction had the lowest p-value in our study.
After this week’s powerful rally, the approach of the April 20 Mercury-Mars conjunction is another reason why would we could see some downside next week. The updated cumulative trend chart has a clear bearish bias which may or may not shape market direction in the coming days. Nonetheless, it is a negative influence that would require some significant bullish offset if the market rally is to continue.
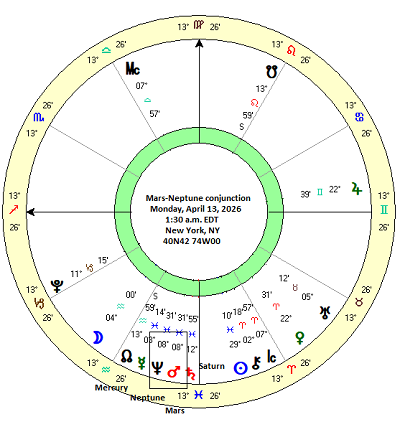
April 13: the Mars-Neptune conjunction
This midweek post considers the effects of the upcoming Mars-Neptune conjunction on Monday, April 13. This conjunction is the early part of the mid-April quadruple conjunction that also involves Mercury and Saturn and is focused around April 19-20. By itself, Mars-Neptune conjunction has a bit of a bearish reputation but it is always a good idea to examine the data and see to what extent its reputation is deserved.
The table below shows the closing prices for the DJIA at various intervals before and after the Mars-Neptune conjunction from 1950 to 2026. This conjunction occurs about once every two years. Prices were recorded at 3-day intervals starting from 18 days before the conjunction until 18 days after the conjunction.
The summary statistics table below analyzes the price changes at different intervals. The results were surprisingly bullish. Most of the intervals had positive price changes and several actually reached statistical significance (p < 0.05). The first column (“-18d 18d”) had an average increase of 2.27% and was statistically significant (p = 0.028). This date range equates to March 26 to May 1 for the current conjunction. While the net lean was clearly bullish, we should note that only 70% of cases were bullish across that interval. In other words, a bullish outcome for this conjunction is far from certain.
One bearish interval was the 6-day approach to the conjunction (“-6d 0d”). This was also statistically significant and produced a positive result only 40% of the time. Although bearish, the average decline was only -0.56% — a very modest influence.
This would seem to have very limited applicability to the current conjunction since stocks have been bullish so far in the days leading up to the Apr 13 conjunction. Some mean reversion is possible in the coming days, of course, but we should admit that this influence may prove to be of secondary importance.
Interestingly, the period after the conjunction tends to be bullish as seen in the “0d 18d”and “0d 12d” intervals. Does this mean that stocks are likely to extend their rally after the April 13 conjunction next week? It’s possible but it may make more sense to think of this conjunction as broadly supportive of sentiment rather than a decisive factor that could determine market direction. The triple conjunction on April 19-20 of Mercury, Mars and Saturn may well have the final say in the matter. While the 5th conjunction of the Mercury-Mars conjunction is bearish, previous triple conjunctions were not clearly bearish or bullish. Given this range of influences, we could therefore see a choppy, mixed market for another week or two.
In Sunday’s newsletter, I will outline the potential bullish influence of a less-obvious alignment, namely, the septile aspect between Saturn and Uranus. The septile is a little-used aspect that describes an angular separation of 51.4 degrees between two planets. This is a conjunction in the 7th harmonic, or D-7 Saptamsa in Vedic astrology.
Disclaimer: Not intended as investment advice. For educational purposes only.
