

 (29 March 2026) Another week, another failed rebound. Stocks fell for the fifth straight week as hopes evaporated for a quick resolution to the US/Israel-Iran conflict. The growing likelihood of US troops on the ground only added to the market’s pessimism as the interruption to the world’s energy supply could drag on for months.
While I had been cautious about last week, the extent of the late week selling was surprising. We did see some expected early week gains on the Sun-Saturn-Pluto alignment and the positive after-effects of Mercury’s reversal from retrograde to direct motion on March 20, but the gains did not hold. The ongoing triple conjunction of Mercury, Mars and the North Lunar Node may have had the last word once again.
The updated cumulative trend chart below underscores the negative potential of this triple conjunction. Of course, the current alignment has been far more bearish than the average of previous alignments. Nonetheless, the negative bias in the days following the conjunction has been confirmed by the current pullback. The charts indicate that the the average and median interim lows occur around 18 days after the triple conjunction, which would be April 3 for the current case. This doesn’t mean that stocks will continue to fall this week since each conjunction has unique co-factors and follows its own trajectory. But it does hint at the risk of further downside in the near term.
The transit of Saturn to 6 degrees of sidereal Pisces offers somewhat more bullish prospects. This alignment of Saturn with the Sun of the NYSE chart has a bearish bias but the cumulative chart below shows that the current transit at 35 days after the alignment has now passed its average and median low points at 30 days after. While the same caveat of the distinctiveness of each transit applies here, the fact that the market has now exceeded the typical interim low argues for at least a mean reversion bounce.
April 12-20: triple and quadruple conjunctions
As discussed last week, April’s four-planet conjunction of Mercury, Mars, Saturn and Neptune is a very rare alignment. So rare, in fact, that it has never happened during the 130 years of the Dow Jones Industrials. Will it be bullish or bearish? Without previous cases to analyze, it becomes more difficult to forecast its possible impact on the markets. Certainly, the inclusion of malefics Mars and Saturn would seem to open up the possibility of volatility although without supporting data it is hard to say. And yet our study of previous Mars-Saturn conjunctions showed they were surprisingly neutral in their effects. But what happens when Mercury and Neptune are added to the mix?
Let’s bracket Neptune for the moment as it is now four degrees away from Saturn and so its Mercury and Mars conjunctions will occur about a week earlier. We can therefore focus on the triple conjunction of Mercury, Mars and Saturn on April 19-20. This is also quite rare, with only three close conjunctions (using a 3 degree orb) occurring since the launch of the Dow in 1896:
February 21, 1966
March 21, 1996
April 2, 1998
These three triple conjunctions most resemble the alignment that will occur on April 19-20, the additional conjunction of Neptune notwithstanding. The table below shows the closing prices of the Dow at various intervals before and after the conjunction.
With such a small sample, aggregating the data isn’t very useful. It makes more sense of examine each alignment on a case-by-case basis. Just eyeballing the data, we can see there were three very different outcomes: the 1966 conjunction was quite bearish, the 1996 conjunction was choppy without any clear direction and the 1998 conjunction was bullish. There is no clear pattern there.
If we look at the broader planetary picture for 1966, we quickly spot why that triple conjunction was so bearish: it occurred exactly opposite Uranus and Pluto. This is obviously a tense alignment which reflected the traditional bearish expectation of planets in hard aspect (90/180 degrees) with Saturn. However, the current planetary set up doesn’t have any such hard aspects with Saturn. This is one very important difference between the the 1966 bearish outcome and the current alignment. This therefore reduces the likelihood of a major sell-off in April.
![]()
In the absence of any hard aspects between slower-moving planets and Saturn, a more likely scenario would be either a middling chop like 1996 or a bullish up trend like 1998. There is some resemblance to 1996 given the current 60-degree sextile alignment between Saturn and Pluto. This echoes a 60-degree alignment between Saturn and Neptune in 1996. These “soft” aspects (60, 120 degrees) tend to be less bearish and can sometimes even coincide with gains.
![]()
The bullish outcome of the 1998 triple conjunction was likely related to the favorable aspects involving Jupiter — Jupiter-30-Uranus just before the conjunction and then Jupiter-120-Chiron in the weeks after the conjunction. Close outer planet aspects involving Jupiter are usually bullish and may be strong enough to redirect any negative influence from this triple conjunction. Are there any such Jupiter alignments now? No, Jupiter does not form any major aspects with other slow-moving planets. This would seem to reduce the odds of a strong rally around the time of the triple conjunction in mid-April.
![]()
Based on just these three cases at least, a range-bound choppy market is the more likely outcome for April. We will leave a discussion of the possible role of Neptune in the quadruple conjunction for my next post. More immediately, markets this week could be influenced by the 240-degree Mercury-Jupiter alignment that is exact on April 3.
![]()
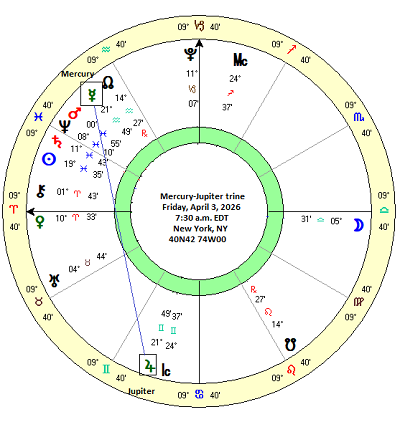
April 3: the Mercury-Jupiter trine
For the short term, it’s worth looking into the possible effects of the upcoming Mercury-Jupiter trine on Friday, April 3. On that date, Mercury will be 240 degrees from Jupiter and will form a supposedly favorable trine aspect (N.B. both the 120-degree and 240-degree alignment are considered trine aspects). Both planets are natural benefics and most astrologers would assume a bullish bias for stocks around the time of the exact aspect. Let’s look at the data to see if that belief is justified.
The table below gives the S&P 500 closing prices at 2-day intervals before and after the previous 42 Mercury-Jupiter trines from 2010 to 2026. A 2-day interval was used instead of the usual 3-day interval due to Mercury’s relatively faster speed.
The summary statistics table below shows the percentage change across various intervals before and after the 120 and 240-degree separation of Mercury and Jupiter. No outcome reached statistical significance and most intervals were neither bullish nor bearish but merely neutral. A few shorter intervals had a net bullish lean although the effect was tiny — just 0.56% for the “-4d 4d” interval. While this was double the benchmark expectation for this 8-day window, its p-value of 0.341 never got close to reaching the significance threshold of 0.05.
Do these results invalidate the bullish thesis for the Mercury-Jupiter trine? Yes and no. They do suggest there is no strong correlation between this alignment and the stock market. But if we disaggregate the sample, then a more intriguing picture emerges.
Direction matters: disaggregating direct from retrograde motion
The April 3 alignment of Mercury and Jupiter will see both planets moving forward in direct motion. To best replicate this condition in the data, we should select only those previous cases in which Mercury and Jupiter were also moving forward rather than when either planet was retrograde.
The summary statistics table below offers some decent evidence to support the conventional belief about Mercury-Jupiter aspects. Most intervals displayed a clear bullish net lean with much lower p-values. One interval, the 12-day window that starts 6 days before the alignment and ends 6 days after (“-6d 6d”), did reach statistical significance. Even here, however, the average gain was quite modest at 1.65%.
The bullish bias of this direct motion sub-sample is also seen in the cumulative trend chart below. After dipping below the benchmark 6 days before the alignment (“-6d”), both the average and median lines move above the benchmark line for the duration of the backtesting period. This is evidence that the most bullish period starts 6 days before the alignment and ends 8 days after the alignment. In current terms, that equates to March 28 until April 11.
Interestingly, the period immediately before and after the alignment is neutral (“-2d 2d”). This would seem to negate the commonly-held belief that the most bullish time for this alignment is one or two days before or after it is exact. This suggests that any gains from this alignment may be spread out across a somewhat longer time span.
Implications for this week
Although the bullish effect of this week’s Mercury-Jupiter trine is quite modest, it nonetheless creates a plausible rationale for a rebound. Whether or not it holds by Friday remains to be seen, however. Previous rally attempts over the past two weeks have all failed as developments in the Middle East continue to worsen the economic outlook. It’s possible we could finally break that losing streak this week, especially since the negative effects of the March 15 Mercury-Mars-North Node triple conjunction may start to fade as we enter the month of April.
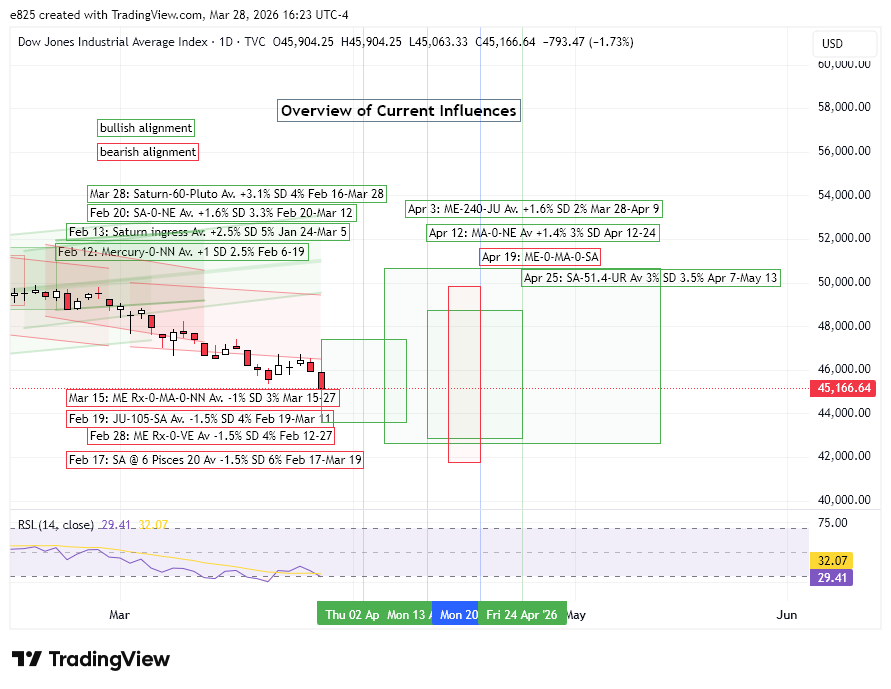
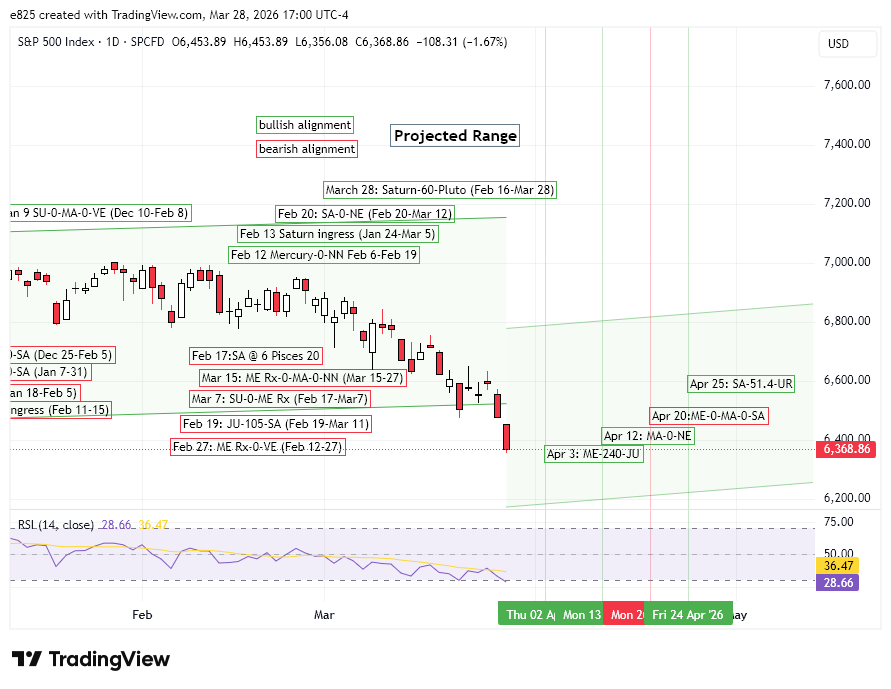
And yet the coming of the quadruple conjunction in mid-April leaves the door open to further volatility. Our case study of previous triple conjunctions involving Mercury, Mars and Saturn offered some tentative evidence that a major sell-off is less likely in April, however. As the updated DJIA and SPX charts show, there are some potentially bullish alignments upcoming in April and May which could at least signal a durable rebound.
Disclaimer: Not intended as investment advice. For educational purposes only.
