

 (18 January 2026) Stocks ended the week slightly lower as investors pondered the future of the Fed’s independence after Trump’s latest comments about Fed Chair Jerome Powell. Despite the pullback, the S&P 500 did manage to make new intraday highs although it fell a bit short of the 7000 level.
This sideways consolidation is not unexpected given the current mix of planetary influences. The dominant influence is still the triple conjunction of Sun-Mars-Venus on January 9. My study suggested that this is a bullish influence that can last for several weeks after the exact conjunction. Backtesting of previous such conjunctions showed an average 4% gain across a 60-day window (i.e. 30 days before until 30 days after) and reached statistical significance (p<0.05) across multiple time intervals.
However, some of the bullish energy of this triple conjunction could be at least partially offset by the presence of some negative alignments in the second half of January. My post two weeks ago showed the potential negative impact of the Sun-Venus-Saturn alignment on January 15-16. The cumulative trend chart showed a bearish bias in the days following the exact alignment. Although noteworthy, the small sample of just 10 cases did not produce statistically significant correlations although a couple of intervals came close.
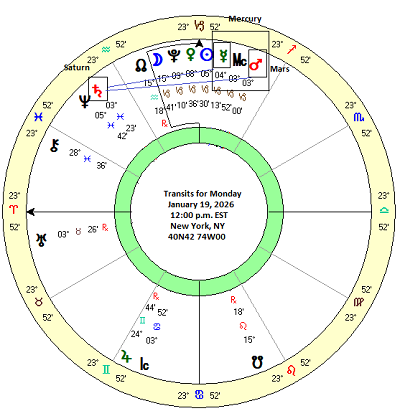
The second half of January features two other possible trouble spots for markets as Mercury conjoins Mars and sextiles (i.e. 60/300 degrees) Saturn on January 19-20 and then Mars conjoins Pluto on January 27. In this week’s post, we will examine the possible effects of the first of these alignments as Mercury and Mars will align with Saturn.
A second dose of Saturn
Just as the Sun and Venus aligned with Saturn last week, this week Mercury and Mars will form their own conjunction and thus enter into a similar sextile aspect with Saturn. The closest alignment occurs on Monday, January 19, although the Mars-Saturn sextile is exact the following day on January 20.
In order to gain a better understanding of the possible effects of this three-planet alignment, I broke it down into two samples: the first sample consisted of the more common Mars-Saturn sextile. The second sample was the much rarer Mercury-Mars-Saturn alignment. The Mars-Saturn sextile occurs about once a year whereas the Mercury-Mars-Saturn alignment in which Mercury conjoins Mars and both are 60 degrees away from Saturn has only occurred 11 times in the past 120 years.
Mars-60/300-Saturn
The table below shows the closing prices across a sequence of 3-day intervals on the Dow Jones Industrial Average (DJIA) for all 49 Mars-Saturn sextiles from 1980 to 2026. The sextile is a 60-degree aspect (the 360-degree circle divided into 6 equal segments) and is believed to represent a harmonious blending of energies between two planets. For the purposes of this study, I included both the 60-degree and 300-degree alignments according to standard counterclockwise reckoning. Both feature a 60-degree separation of Mars and Saturn with the only difference being whether Mars as the faster planet is applying or separating with the slower-moving Saturn.
The first recorded price was 24 days before the exact alignment and subsequent prices were recorded at 3-day intervals until the final price 24 days after the alignment. The resulting 48-day window was somewhat arbitrarily selected although it is hopefully long enough to offer a comparison of immediate effects closer to the 0-day marker with the longer term effects that might be observed 24 days after the alignment.
While both Mars and Saturn are considered natural malefics, I did not have a strong hypothesis either way regarding this alignment. That’s because my previous studies of other Mars-Saturn alignments were surprisingly bullish (e.g. the opposition). And since the sextile aspect is considered more positive than the square, for example, there was reason to be neutral in my expectations about what this pairing would deliver.
The summary statistics table below shows that this neutral stance is justified by the data. Most intervals show only mildly positive effects as the average and medians are generally higher than the benchmark figures based on an 8.9% average annual return for 1980-2024. From a sample of 49 cases, most intervals generate 30 to 35 positive results. It’s clearly bullish, but not that bullish. Actually only one interval (“-12d 0d”) reached statistical significance highlighting a bullish influence that preceded the exact Mars-Saturn sextile. The period following the sextile was more neutral and did not exhibit a bullish bias.
The cumulative trend chart below confirms the slight bullish bias of this Mars-Saturn pairing. The current line (in red) is generally following this modest bullish bias of previous cases. This is not to say that stocks will continue to drift higher in the coming days and weeks. But it is one influence that may offer support to the market going forward.
Interestingly, the same modest bullish bias was evident after disaggregating the sample into 300 degree sextiles only (n=26). The upcoming Mars-Saturn sextile on Jan 20 will be of this 300-degree variety. It is perhaps slightly less bullish than the aggregated sample but not enough to make a big difference.
Mercury-0-Mars-60/300-Saturn
But in order to more closely replicate the current planetary alignment, a second sample was compiled. Since the inception of the DJIA in 1896, there has only been 11 previous alignments in which Mercury was conjunct Mars and both planets formed a sextile (60 or 300 degrees) with Saturn. Obviously, it a sample of just 11 cases is not a solid basis for making any reliable predictions. But it is nonetheless worthwhile to see if the planets lean one way or the other.
The summary statistics table below reveal some useful observations. Unlike the simple Mars-Saturn sextile, the double Mercury-Mars sextile to Saturn looks more bearish. All of the intervals have averages and medians that are less than the benchmark figure based on a 5.4% average annual return for the years 1897 to 2010. And despite a sample of just 11 cases, one of these intervals (“-6d 0d”) reached statistical significance and three came very close (“-12d 12d”, “-12d 0d”, and “-6d 6d”). This data suggests that a clear bearish influence occurs 12 days before the alignment and lasts until 12 days after, although the “-6d 6d” window had the most negative average and median. That 12-day window is arguably the most bearish. For the current alignment, this would equate to a stronger bearish bias from Jan 13 until Jan 25. The longer 24-day window that is less reliably bearish would extend from Jan 7 until Jan 31.
This negative effect is reflected in the cumulative trend chart below. The current alignment (in red) is slightly above the average and median lines. However, both the average and median lines dip sharply as they approach of the “0d” marker which equates to Jan 19. Given a tiny sample of 11 cases, this doesn’t necessarily mean that stocks will fall in the days ahead but the greater downside risk seems clear.
Implications for this week
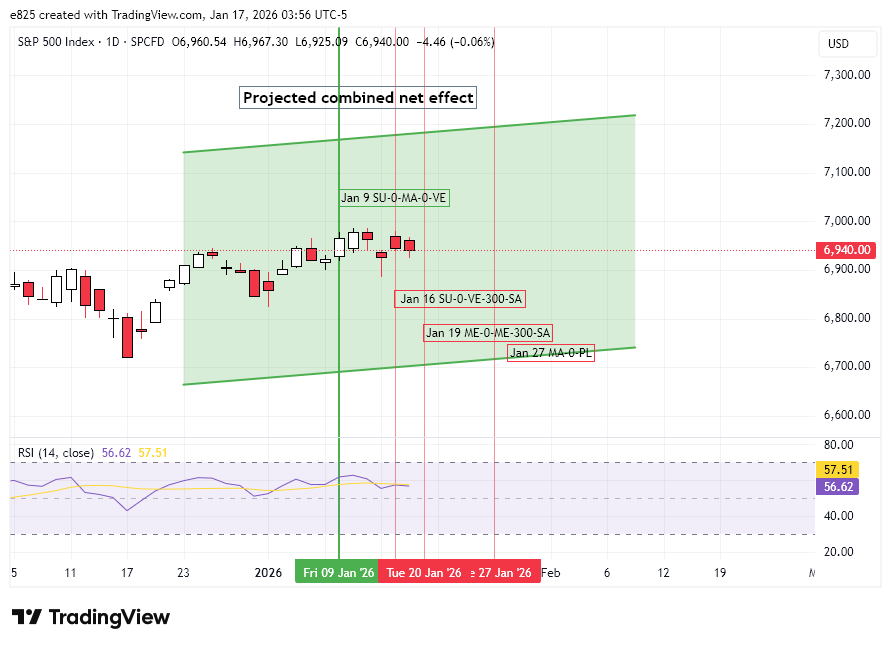
Will stocks fall this week? Certainly, the risk is there given this Mercury-Mars-Saturn alignment, but the mix of influences here makes this a low confidence forecast. The annotated DJIA price chart below reflects the current mix of influences. The downward sloping red channels reflect the possible impact of these negative alignments. Their light red shading convey the relatively high standard deviation (1 SD = 5% or more) and lack of statistical significance and thus ultimately their low reliability.

The upward sloping green channel uses darker shading and reflects the greater price effect and lower standard deviation (1 SD = 3%) of the Jan 9 triple conjunction of Sun-Mars-Venus. This is a stronger bullish effect than either of the bearish alignments (Sun-Venus-Saturn; Mercury-Mars-Saturn) and thus may well remain the dominant influence in the coming weeks. I would note, however, that I have included an additional alignment (vertical line) on January 27, namely the Mars-Pluto conjunction (MA-0-PL). I have pre-emptively colored this red as I suspect it may coincide with some bearishness. Interestingly, this conjunction occurs just one day before the next FOMC meeting – a potential market mover. However, I have not yet crunched the numbers for this conjunction so it remains a question mark for now. That will be the focus on my next post.
I’ve attempted to combine these effects in the S&P 500 chart below. This is not a systematic picture but rather a general projection of possible ranges and their probabilities. The green channel is my baseline assumption of a rising market, although its wide range is borne of its constituent high standard deviations and reflects the inherent uncertainty of the forecast. If nothing else, the projected chart argues against a deep or sustained near term sell-off. And in the event of a pullback, a renewed push to higher highs is still quite possible.
Disclaimer: Not intended as investment advice. For educational purposes only
If you would like to receive these weekly posts as emails, please subscribe to my free newsletter Empirical Astrology.
