

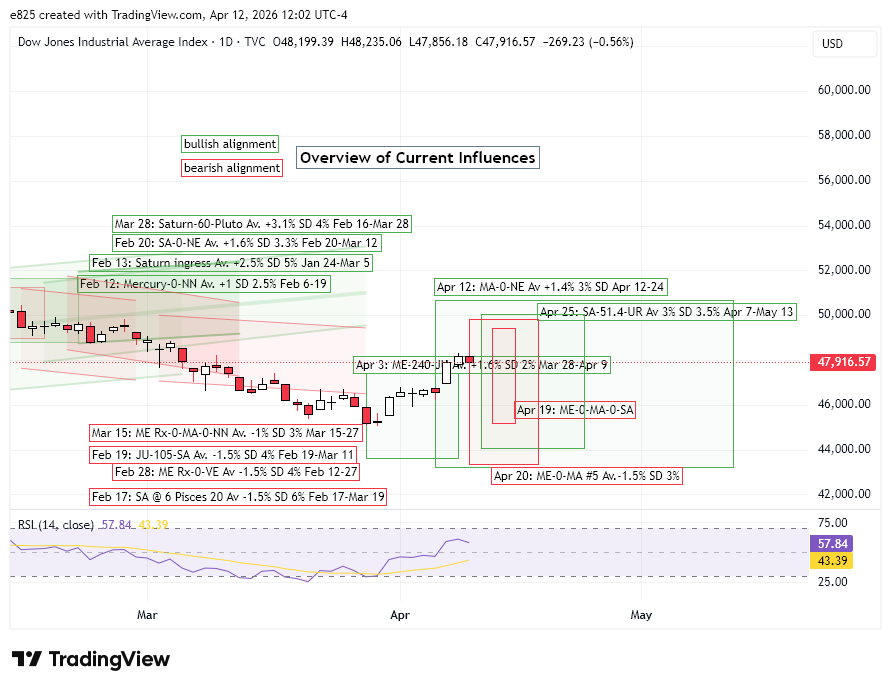
 (12 April 2026) Stocks ended the week sharply higher on hopes that the two-week ceasefire and reopening of the Strait of Hormuz could lead to a permanent end to the Iranian conflict. Amid the optimism and de-escalation, oil prices fell back below $100 a barrel signaling a fundamental shift in market sentiment.
As noted in my Thursday post, much of this rebound since the March 30 low closely coincides with the Mercury-Jupiter alignment. This 240-degree trine aspect was exact on April 3. Based on our backtest, we found that market outcomes were likely to be positive from 6-8 days before (March 26) the alignment and continuing until 6-8 days after (April 11)
We are now entering the less-positive period as that alignment is now separating and hence weakening. But since it is only one alignment, it does not necessarily mean that stocks will fall this week. We still need to consider the other possible influences.
So far we’ve seen no negative impact from the approaching gauntlet of conjunctions that begins April 13 with Mars-Neptune and continues until April 20 with Mercury-Mars. A backtest of previous Mars-Neptune conjunctions suggests it could actually be somewhat bullish. However, the triple conjunction of Mercury, Mars and Saturn on April 19-20 is more of a mixed bag with the three previous such conjunctions producing widely disparate outcomes.
The April 20 Mercury-Mars conjunction deserves special attention since it is a fifth conjunction in its current sequence. As we saw in our backtest study, these five-conjunction sequences of Mercury-Mars have a bearish track record. Based on prior cases, their most negative effects can begin 6 days before the conjunction (i.e. April 14 for the current conjunction) and can last until 6 days after, if not longer. This equates to April 26 for the current conjunction.
Given the diminishing effects of bullish Mercury-Jupiter alignment and the intensifying effect of the bearish Mercury-Mars conjunction, we may be are more likely to see a pullback this week, if not next week as well. The size of any potential pullback is unclear although our backtest of the Mercury-Mars conjunction suggests it could be larger than a normal period of post-rally sideways consolidation.
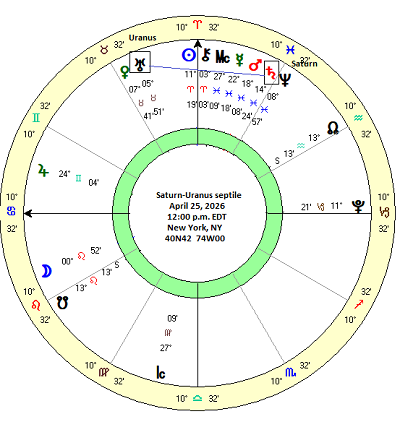
April 25: the Saturn-Uranus septile aspect
After the April 20 Mercury-Mars conjunction, the next potential market mover could be the Saturn-Uranus septile aspect on April 25. The septile aspect is a lesser-known aspect in which two planets are separated by 51.4 degrees, i.e. the 360-degree circle divided into seven equal parts of 51.4 degrees. Planets in septile aspect are actually conjunct in the 7th harmonic chart, or the D-7 Saptamsa as it is known in Vedic astrology. Since I actually have very little experience with the septile aspect and rarely use it, I thought I would do a backtest study to see if it had any effect on stock prices. To my surprise, the effects were noteworthy.
The table below shows the closing prices for the DJIA from 1904 to 2026 at 3-day intervals before and after the Saturn-Uranus septile. As the table shows, this alignment is quite rare. As is often the case, there is a clustering of alignments within a shorter one-year period as both planets move back and forth through their retrograde cycles. The resulting sample yields just 13 cases, however. Clearly, it will be difficult to make any high confidence predictions from such a small sample. But we can still assess the results with an eye to the overall direction of the outcomes. And statistical significance still counts here, even with a small sample.
The summary statistics table below reveals the bullish effects of this septile aspect. The first column shows the longest interval of 36 days — from 18 days before the alignment until 18 days after. This had an average gain of 3.21% against a benchmark figure of 0.55% based on a 5.3% average annual return for the DJIA from 1904 to 1996. Moreover, this interval had a p-value of 0.016 and thus was statistically significant (p<0.05) with 77% of cases producing positive outcomes.
The clear bullish bias of this alignment was supported by the fact that the median closely tracked the average. Several other shorter intervals also had statistically significant results including the 18-day interval (“-9d 9d”) and the 12-day interval (“-6d 6d”). The most bullish interval was the 12-day (“-6d 6d”) which had the highest percentage of positive cases (85%) and the lowest p-value (0.005). For the approaching septile aspect on April 25, this would suggest that the period from April 19 to May 1 is more likely to produce bullish returns, all other factors being equal.
The cumulative trend chart below illustrates the bullish bias of this 51.4 degree alignment between Saturn and Uranus. While the current alignment is well above the average and median lines, we can see that these lines tilt sharply upward a bit before the day of the exact alignment (Apr 25) and continue to rise thereafter. This implies that the most bullish effect of this alignment may be after its exact alignment on April 25.
Expanding the sample size: septile, biseptile, triseptile
Since it is difficult to extrapolate from just 13 cases, let’s see if the bullish bias of this alignment is replicated if the sample size is expanded to include similar other 7th harmonic alignments. Thus the septile aspect of 51.4 degrees (S1) is mathematically echoed with the biseptile aspect of 102.9 degrees (S2) and the triseptile aspect of 154.3 degrees (S3). All three of these angular separations appear as Saturn-Uranus conjunctions in the 7th harmonic chart (aka the D-7 varga chart) and thus they can be temporarily considered as a single planetary influence. By aggregating all three septile multiple aspects, the sample size was expanded to 63 cases. The closing prices of these septile multiples are shown in the table below.
The results replicate the bullish bias of the smaller sample, although the positive bias is somewhat less, as seen in the summary statistics table below. Thus the first column (“-18d 18d”) had an average of 1.59% — well below the 3.21% in the smaller sample. But the median was substantially larger here at 2.51% suggesting the average may have been lowered by some negative outliers.
In fact, the much lower average can be attributed to a single case — the 102.9 degree biseptile alignment on Oct 18, 1929. This alignment occurred just one week before the famous 1929 crash and thus its 36-day interval posted a -32% decline — big enough to skew the total average price change relative to the median. Not surprisingly, most median price changes were larger than the average price changes. But since statistical significance is based on the average and not the median, none of the intervals reached statistical significance.
Nonetheless, the bullish bias of the larger multiple septile sample can be seen in the cumulative trend chart below. While the average and median lines are somewhat lower than the 51.4-degree septile sample (n=13), both lines are still trending higher and easily exceed the benchmark line for most of the backtest period. As in the smaller sample, the period after the exact alignment appears to be the most bullish. This suggests that the septile alignment on April 25 is more likely to be a positive influence on stocks after that date.
Implications for this week
The bullish influence Saturn-Uranus septile is unlikely to have any direct impact on stocks this week. Its effective influence is more likely to manifest closer to its alignment date of April 25, especially after April 19 which was the start date to the most bullish 12-day interval (“-6d 6d”).
This week therefore could lean bearish as the Mercury-Jupiter trine fades and the negative effects of the approaching triple and quadruple conjunctions begin to be felt. There is no strong evidence about the magnitude of any potential pullbacks. The data suggest at least a mild pullback of 1-2% but given the extent of the recent rally, any mean reversion to the averages could mean a larger decline. Certainly, there is increased downside risk given today’s announcement of the breakdown of ceasefire talks and the planned US blockade of the Strait of Hormuz.
Disclaimer: Not intended as investment advice. For educational purposes only.
