

 (1 February 2026) Stocks were mostly lower last week amid market turbulence following the sudden crash of gold and silver prices. While the blue chip S&P 500 managed to finish the week slightly higher, all the other major indexes lost ground including the small cap Russell 2000 which fell 2%.
The decline broadly aligned with our model which suggested an elevated downside risk in and around the Mars-Pluto conjunction on Jan 27. While our backtest showed only a modest average decline of -0.5% from this pairing, it nonetheless came very close to reaching statistical significance across several time intervals. The updated cumulative trend chart below indicates an average and median underperformance for at least 6 days after the conjunction. This equates to Monday, Feb 2 for the current conjunction. Further downside is possible, of course, although the data suggest it becomes less likely as time goes on. In the updated chart, we can see that the price effects of the current conjunction (the red line) may also be simply reverting to the mean following a period of outperformance.
Other updated charts indicate a mixed picture. Based on our backtest studies, the strongest influence remains the Jan 9 triple conjunction of the Sun, Mars and Venus. This fairly rare alignment correlated with market strength over a 60-day window before and after the conjunction. The average gain was 4% with a constrained standard deviation of just 3% indicating relatively small distribution of outcomes. However, as we begin the month of February, the bullish influence of this alignment is likely diminishing. Since our analysis only tested intervals up to Feb 8 (30 days after the conjunction), it is difficult to estimate what continued effect it may exert.
Thus far, stocks are tracking below the average and median outcomes from previous SU-MA-VE conjunctions although still above the long term benchmark. Could this mean that stocks rise in the coming days to rejoin those average and median lines? It’s certainly possible although I think stocks have been dragged down by more recent alignments such as the dual sextiles of Sun-Venus-Saturn (Jan 15) and Mercury-Mars-Saturn (Jan 19) as well as the Mars-Pluto conjunction (Jan 27).
The updated chart of the aforementioned SU-0-VE-300-SA alignment shows how the bullish bias of the SU-0-MA-0-VE conjunction has been supporting prices. The current price line (the red line) is well above the average and medians for this otherwise bearish alignment. Some downside is therefore still possible in the coming days as it mean reverts to catch up with the average and median lines, especially since bullish effect of the SU-0-MA-0-VE alignment wanes.
One major caveat is that this Sun-Venus-Saturn sextile sample consists of only 10 cases. Although the average decline was sizable, it failed to reach statistical significance for any interval. In other words, the wide distribution of data means its effect is quite unpredictable, even if the bias is clearly bearish.
Taken together, these opposing influences have so far largely cancelled each other out and we have seen it mostly sideways market over the past few weeks.
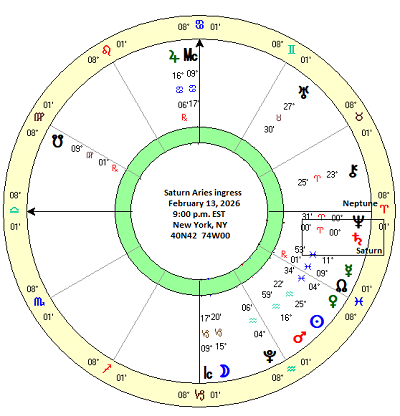
Feb 13: Saturn enters tropical Aries
Our focus this week is the upcoming ingress of Saturn into tropical Aries on February 13. Some readers will know that I tend to follow the Indian sidereal zodiac in terms of planetary sign placements and ingresses. Based on fixed star positions rather than equinoxes, the Lahiri/Krishnamurti ayanamshas are currently about 24 degrees “behind” the tropical zodiac: Saturn is currently at 28 degrees of tropical Pisces but only at 4 Pisces of sidereal Pisces. While I tend to work mostly with the sidereal zodiac, I also acknowledge the importance of Western tropical zodiac positions as they can provide useful information whenever sign ingresses occur.
Since Saturn is a malefic planet, its ingresses (i.e. sign changes) are regarded with some caution as there may be an excess of Saturnian energy when it shifts from one sign to another. That is the traditional understanding at least which may or may not be supported by the data. In order to gain a better understanding of Saturn ingresses, let’s dig into the data of previous ingresses.
But there’s a problem. If we want to examine all previous ingresses of Saturn into tropical Aries for which there is stock price data, we are left with a sample consisting of only 8 cases. Saturn enters Aries only once every 30 years and since the DJIA data only goes back to 1896, that greatly limits our sample size. Even then, we are forced to include ingresses when Saturn is retrograde and moving from Aries back into Pisces.
Can such a small sample size be reliable for making projections for the approaching ingress? I would say no, unless the data was strongly biased one way or the other. And yet astrologers believe that Saturn’s ingress into Aries may be a special case since Saturn is said to be debilitated in the sign of Aries, and thus more likely to wreak havoc. In that sense, we would expect the ingress of Saturn into Aries to be more bearish than it otherwise might be.
The brief table of closing prices below highlight the limits of the data. Closing prices of the DJIA were recorded at various intervals starting at 20 days before the ingress and continuing until 20 days after. Interestingly, the small dataset includes the bear market of 1937. Students of market history will know that this was a devastating decline of 40% and it happened to coincide closely with the ingress series of Saturn into tropical Aries. Was this one reason for the decline? Or was it random chance? Certainly, that one case out of a tiny sample of 8 cases will distort the averages.
The summary statistics table below shows the bearish bias of these Aries ingresses as most of the averages are negative. Not surprisingly, they are also show how the average is significantly lower than the median for most intervals, in large part as a result of those 1937 bear market ingresses. None of the results reached statistical significance, although two intervals came close: the 5 days immediately before the ingress (“-5d 0d”) and and 2 days before the ingress (“-2d 0d”). Given the small sample size, these results are actually fairly impressive and suggest there may be a real bearish effect in the days leading up to the ingress.
Also noteworthy perhaps is that the intervals immediately following the ingress are a quite bullish as the 2-day 5-day and 10-day intervals (“0d 10d”, “0d 5d”, “0d 2d”) are all much greater than the benchmark figure although none reached the threshold of significance (p<0.05).
This bearish-then-bullish pattern is reflected in the cumulative trend chart below. Both the average and median lines fall sharply into the day of the ingress (currently “0d Feb 13”), but then seem to recover thereafter. As already noted, the average line has to be taken with a grain of salt since it will be unduly impacted by the 1937 bear market case. But with only 8 cases in total, we would be wise to question the usefulness of this chart.
But if the data is too thin to make for reliable projections, we need to expand the sample.
Measuring the effects of all Saturn ingresses
One way to achieve this is to include all 12 Saturn sign changes. The cost of this strategy is the loss of the potential uniqueness of the Aries ingress, as we are now assuming that the common attributes of all Saturn ingresses — whatever they may be — outweighs the uniqueness of the Aries ingress. The advantage is that we can now construct a sample that is large enough so that it has a better chance of saying something meaningful about the upcoming Saturn ingress into Aries.
To that end, I recorded closing prices of the DJIA at various intervals across a 40-day window for all Saturn sign ingresses from 1967 to 2026. This yielded a sample size of 50 cases as seen in the table below.
The summary statistics table below paints a somewhat different picture from the similar Aries ingress table. Most of the interval averages and medians are positive and exceed the benchmark. In other words, this could actually be a bullish influence overall. Two of the intervals reached bullish statistical significance (p<0.05) and a third came close. Interestingly, we do notice some negative outcomes in the shorter intervals close to the day of the exact ingress, although none were statistically significant. This offers some confirmation of the negative effect in the Aries ingress in the intervals nearer to the day of the sign change.
The cumulative trend chart below shows the overall bullish effect of the Saturn ingress. Prices generally rise from 20 days before until 2 days before, after which they tend to fall until 2 days after the ingress. As with the Aries ingress, there seems to be a pronounced bearish effect in the days around the ingress. In the run-up to the current Feb 13 ingress, this would equate to some market weakness from Feb 11 to Feb 15. Although this is a fairly consistent finding, we should note that it still quite small on average, perhaps just a -0.5% decline across 4 days.
After the dip around the ingress day, prices then resume their upward climb. Based on a 40-day window, the average and median gain was about 2.5%, albeit with a standard deviation near 5% indicating wide distribution of the data which lessens its predictive reliability.
We can further refine our analysis by sampling only the third and final ingress of each sign. The upcoming Aries ingress will be one such third ingress as it marks the last time in the series that Saturn will enter tropical Aries. Could this produce different results than the other two ingresses in each series? It’s possible, as it is believed that the final ingress may be less disruptive than the previous two since Saturn becomes more ‘comfortable’ with its new sign placement.
Certainly, the summary statistics table and cumulative trend chart below offer some support for that belief. The average and median lines are very similar in their orientation with the tell-tale dip around the day of the exact ingress (“0d Feb 13”) and then a strong rally afterwards. But here we notice that the median and average rise higher — to 3% and 4% respectively during the 40-day window. This is another clue that the upcoming Saturn ingress into Aries could actually be quite bullish.
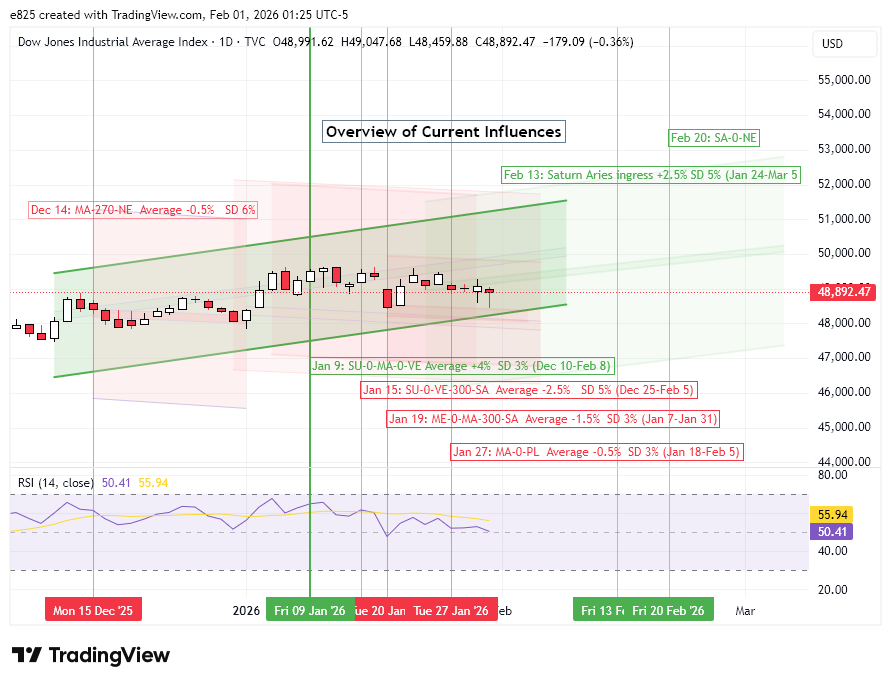
While the specific Aries factor may be ultimately unanswerable given its small sample size, the weight of the evidence looks more bullish than bearish. For this reason, the channel in the DJIA current influences chart that extends into the period covered by the February 13 ingress is green and rising. Based on the 40-day window used in the backtest, this period of bullish influence lasts until March 5.
Implications for this week
As we are still in the early stages of the Saturn ingress, it is possible that some of its bullishness could manifest this week. However, it is less clear if this will outweigh the other influences outlined above. The Mars-Pluto conjunction could still exert a bearish influence this week, and the Sun-Venus-Saturn alignment may also be prone to some downside in the days ahead.
Alas, assigning influence to single alignments is more straightforward than combining multiple simultaneous alignments and arriving an overall net effect. Nonetheless, I have attempted to do that here with the S&P 500 projected combined net influence chart. Given the probable bullish influence of the Saturn ingress, I have extended the rising green channel into early March. However, I have also flattened the upward angle of the channel somewhat to reflect the effect of some potential dips along the way.
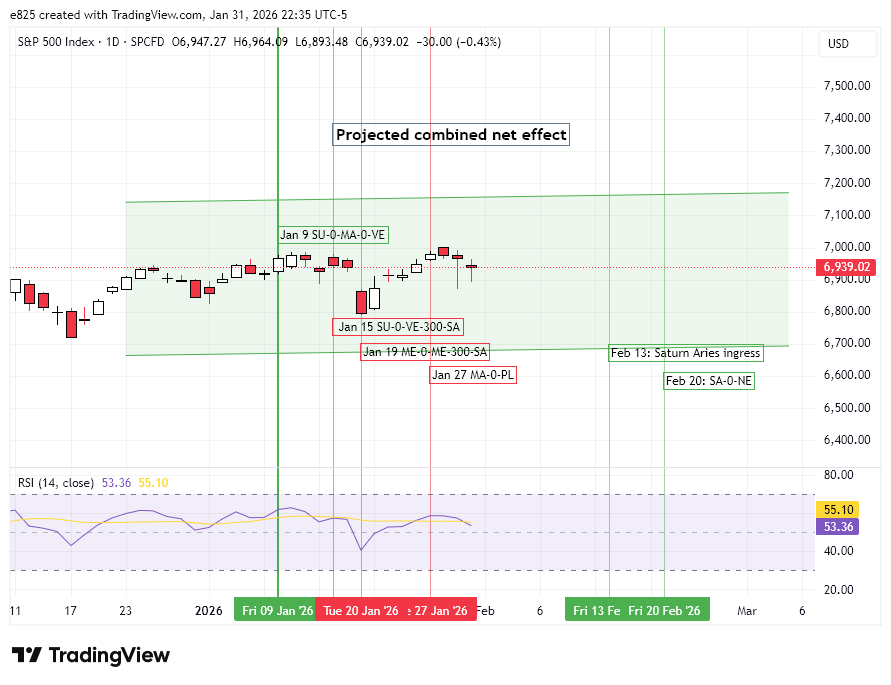
The combined effect of these influences still seems bullish overall for the next several weeks.
Next week, we will take a look at the probable impact of the Saturn-Neptune conjunction that is exact on Feb 20. My preliminary analysis suggests that this could be a bullish influence and thus it has been drawn in green on the DJIA current influences chart.
Disclaimer: Not intended as investment advice. For educational purposes only.
If you would like to receive these weekly posts as an email, please subscribe to my free Empirical Astrology newsletter on Substack.
