

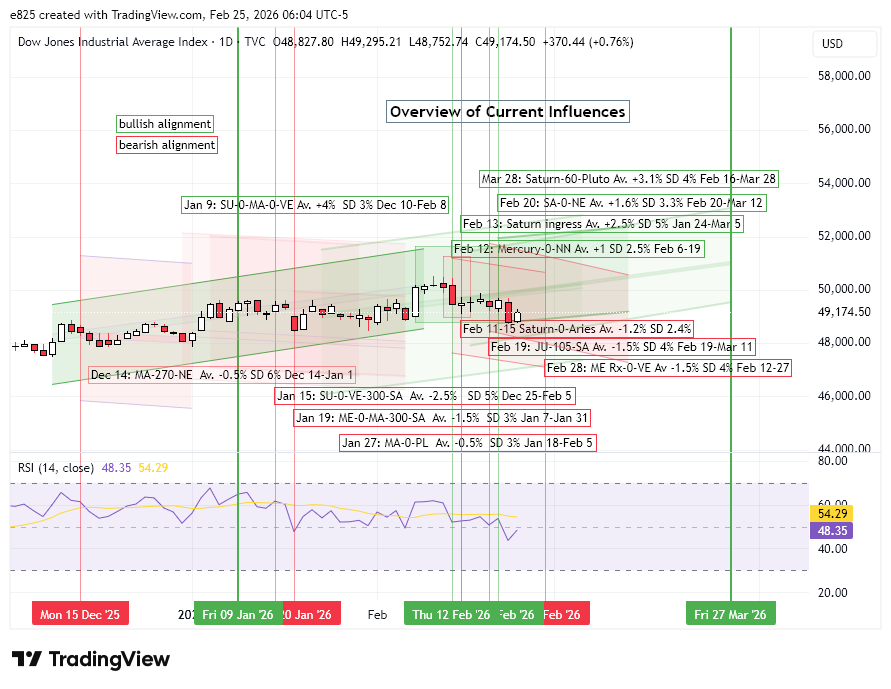
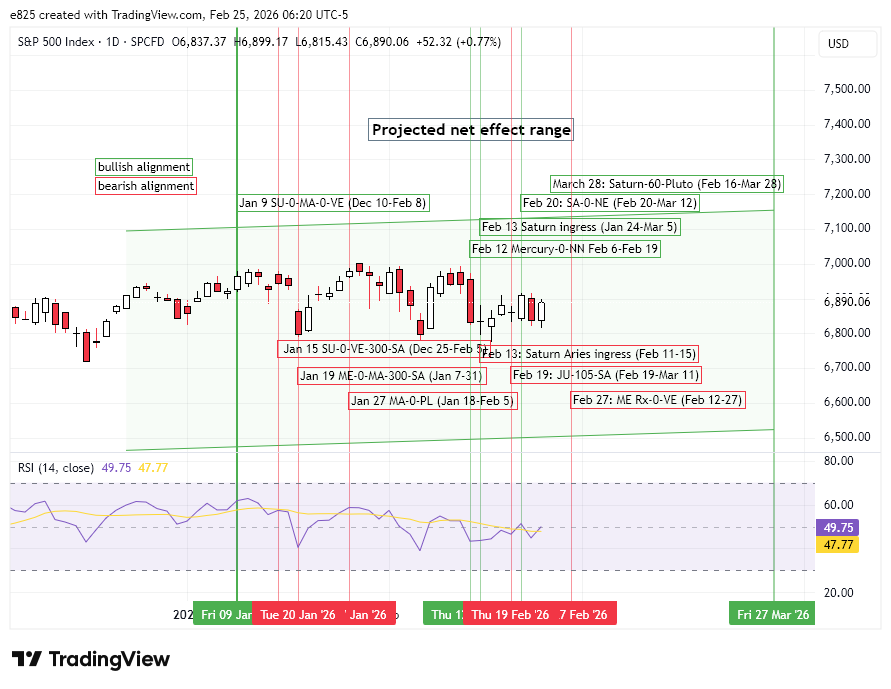
 (25 February 2026) So far this week US stocks have been choppy with a slight bearish bias as most indexes have moved lower. This isn’t surprising given the approach of the conjunction between retrograde Mercury and Venus on Saturday, as well as the Mercury retrograde station on Thursday. The Jupiter-105-Saturn alignment may also be contributing to the volatility. While there is some decent evidence to expect further downside in the coming days, the prospects for the medium term seem less negative.
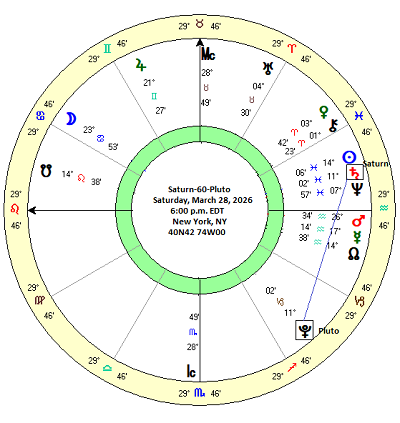
One reason for a more balanced stance is the approach of the Saturn-Pluto alignment on March 28. This is a 60-degree “sextile” alignment in which Saturn and Pluto are separated by 60 degrees — an astrologically significant angle. On the face of it, this alignment doesn’t look like anything special. Saturn can be bearish but not always, and Pluto can go either way depending on other factors. The 60-degree alignment is often regarded as a “soft” and hence benign aspect. Given these competing factors, let’s take a look at the actual data before we jump to any conclusions.
The table below shows the closing prices for the Dow Jones Industrials (DJIA) at various intervals before and after the exact 60-degree alignment for the years 1910-2013. The sample is comprised of 19 cases. The price was recorded at five-day intervals starting at 40 days before the alignment (“-40d”) until the final price 40 days after the alignment (“40d”). The second column specifies which transit in the 3-transit series for each alignment. Due to the retrograde motion of both planets, the 60-degree alignment typically occurs three times before the planets separate for good, not forming another 60-degree separation for another 22-23 years. The third column specifies the counterclockwise angle between the two planets — either 60 or 300. While both are considered 60-degree sextiles, the 60-degree alignment has the faster-moving Saturn separating from Pluto while the 300-degree alignment has Saturn approaching Pluto. This difference will be further explored below.
The summary statistics table below analyzes the different outcomes across various intervals. The first column (“-40d 40d”) is the longest interval consisting of 80 calendar days. It produced an average increase of 3.12% and a median increase of 0.82% for that time period. This compares with a benchmark increase of 1.12% based on a 5.1% average annual return for the years 1910-2013. While the average is impressively large, the median return is merely typical and suggests the average is being boosted by a few outsized results. Not surprisingly, it did not reach statistical significance of less than p=0.05.
However, the story becomes more interesting when we look at the second and third columns. The second column (“-40d 0d”) shows general agreement between the average and median as both are above 3% for the 40-day period. This was far enough above the benchmark of 0.56% to be statistically significance posting a p-value of 0.026. This means that the outcome had a 97.4% probability of not being the result of chance.
Interestingly, this bullish bias disappears in the third column which measures price changes for the 40 days after the alignment (“0d 40d”). The median is very close to the benchmark and the average is even slightly positive.
This pattern of “bullish before/neutral after” can be seen in several of the column pairs. Statistically significant results occur for the 35-day, 30-day and 20-day interval before the exact 60-degree alignment.
While these statistically significant results deserve to be taken seriously, we should note that the absence of any strong correlations in the shorter intervals mean that there is considerable variability throughout the duration of this transit. It may mean that the bullish bias may not manifest continuously up until the date of the exact alignment (i.e. March 28 for the current case).
This pattern is evident in the cumulative trend chart below. Both the average and median lines track well above the benchmark up to the time of the exact alignment. After that they diverge somewhat with the average staying elevated but flat and the median sharply declining starting from 15 days after the exact alignment. This would equate to April 12 for the current case.
Disaggregation: Saturn-60-Pluto only
Disaggregating the results into two groups highlights a difference between the 60-degree alignments and the 300-degree alignments. The upcoming March 28 alignment will belong to the 60-degree group.
The summary statistics table below analyzes the effects of these 9 cases. Of course, since 9 cases is a tiny sample, we should be cautious about extrapolating too much from it. But the results are so strong that they are worth noting. Amazingly, despite the small sample, two of the intervals produced statistically significant results while two others came very close (No* indicating a p-value of less than 0.10 but more than the standard threshold of 0.05.)
The cumulative trend chart illustrates a similar pattern with the larger sample although the average and median rise higher up until the exact alignment and fall off more sharply in the aftermath.
Implications
While this is a bullish influence, it is not a guarantee that stocks will be higher on March 28 than they are now. It is, after all, only one alignment out of many. And although it is a fairly strong correlation, it is important to note that the average gain of 3-4% occurs over a fairly long period of 40 days. That works out to a fairly modest 0.5% rise per week on average.
The approach of this Saturn-Pluto alignment therefore does not preclude further downside over the near term. But it does suggest that any dips are likely to be bought sometime in March, even if we don’t see the DJIA move above its current level by the time of the alignment on March 28. Therefore, the Saturn-Pluto alignment could act as a floor below the market which may reduce the likelihood of steep declines, if not actually taking prices higher.
If you would like to receive these posts as emails in your inbox, please subscribe to my free Substack newsletter, Empirical Astrology.
Disclaimer: Not intended as investment advice. For educational purposes only
