

![]() (15 March 2026) Stocks fell for a third straight week last week as rising oil prices from the war with Iran reignited inflation fears. Despite the geopolitical tensions and the flood of dramatic headlines, the current pullback sees the major indexes still within 5% of their recent all-time highs.
(15 March 2026) Stocks fell for a third straight week last week as rising oil prices from the war with Iran reignited inflation fears. Despite the geopolitical tensions and the flood of dramatic headlines, the current pullback sees the major indexes still within 5% of their recent all-time highs.
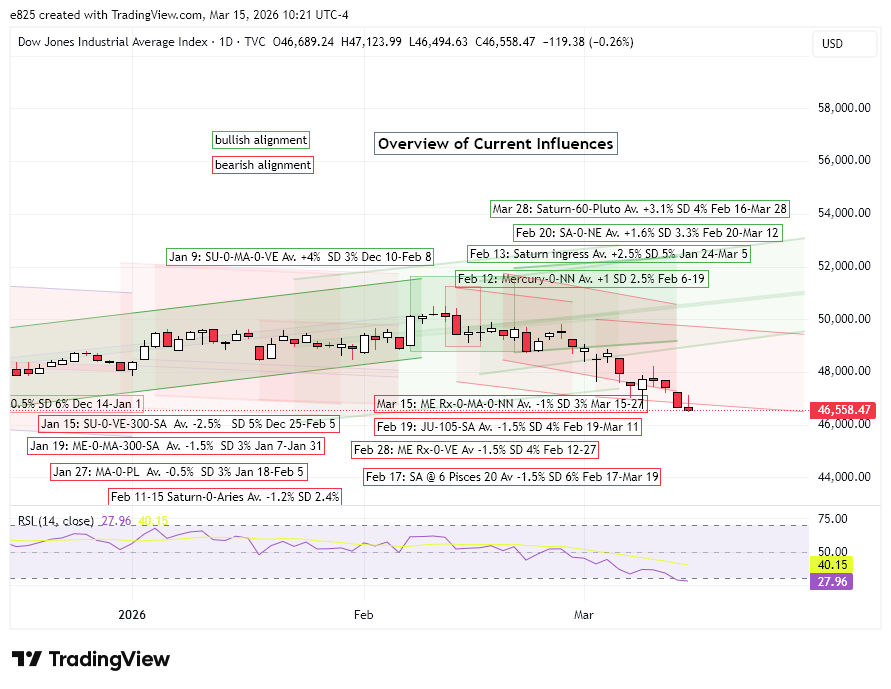
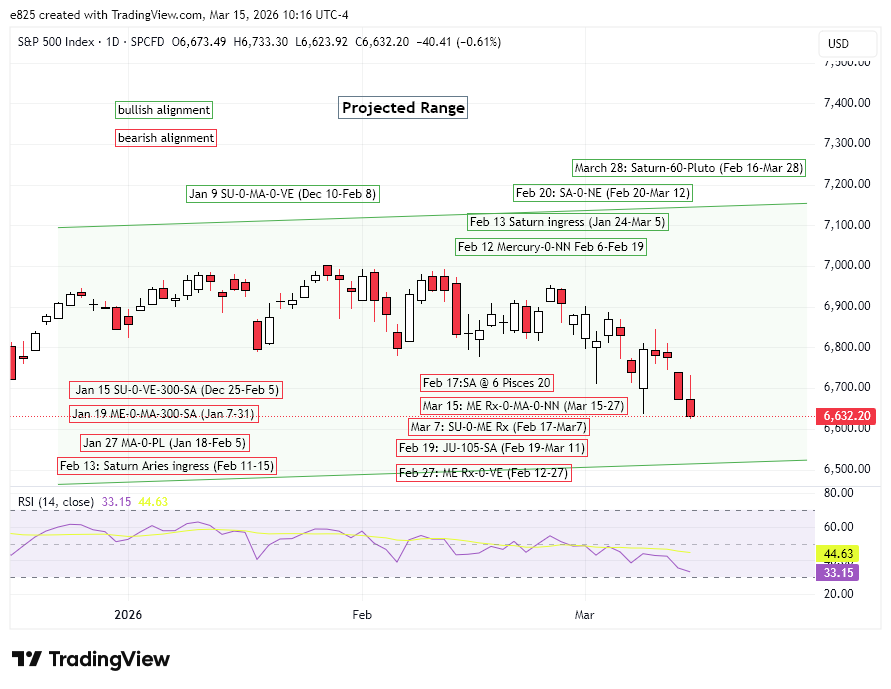
The decline was not unexpected given the range of influences in play last week. I had been skeptical of the positive net effect indicated by the Alignment Calendar given the downside risk of the approaching triple conjunction of Mercury, Mars, and the North Node. Our backtesting suggested an interim low was more likely to occur 3-6 days before the March 15 conjunction. That did not preclude further downside last week, and Friday’s low that occurred 2 days before the conjunction was within an acceptable range from these backtest results. We should also note that this could ultimately be an interim low since the cumulative trend chart shows another potential low occurring 18 days after the conjunction. This would equate to April 2 for the current alignment. This could either be a higher low as suggested by the dark blue median line or a lower low as reflected in the light blue average line.
The updated cumulative trend charts of the current alignments suggests that a rebound may be imminent. Besides the Mercury-Mars-North Node conjunction, the effects of the 105-degree Jupiter-Saturn alignment are approaching their average bottom this week. While the current alignment is tracking well below its long term average and median, we should also pay attention to the direction of the lines. The median line has already turned back up at 20d (i.e. 20 days after the Feb 19 alignment) and the average line will follow suit in the coming days.
The Mercury Rx-Venus conjunction is already well past its theoretical low point both in time and price and may now therefore be more likely to revert to its long term mean.
A missing transit: Saturn @ 6 Pisces (sidereal)
The recent negative market performance has forced me to consider other factors which I may have previously missed. One such factor is the transit of Saturn to 6 Pisces (sidereal zodiac, Krishnamurti/Lahiri ayanamsha). This transit of Saturn over 6 Pisces on February 17 was lost in the shuffle since it is a simultaneous ingress of Saturn into tropical Aries. (6 Pisces sidereal = 0 Aries tropical). We have already covered the possible negative short term impact of that tropical Aries ingress on Feb 13. But the sidereal position of Saturn at 6 Pisces 20 becomes more relevant when we realize that this forms an exact 60-degree sextile (3rd house aspect) to the natal Sun in the NYSE horoscope at 6 Taurus 20. (i.e. 6 degrees and 20 minutes of Taurus)
![]()
The sidereal transit of Saturn to the Sun is arguably more pertinent here since it is precession-corrected for the 233-year old NYSE chart which dates back to 1792. Very old horoscopes like the NYSE become subject to measurement error since the precession of the equinoxes shift planetary positions about 1 degree every 70 years. Even if zodiacal measurement differences can be a source of contentious disagreements among astrologers, I like to at least acknowledge the presence of both zodiacs and consider their unique implications.
To discover the possible impact of this sidereal Saturn sextile to the NYSE Sun, I compiled a small dataset of all previous Saturn transits to 6 Pisces (sidereal). Since the launch of the Dow Jones Industrials in 1896, there has only been five Saturn transits to 6 Pisces and if we include retrograde transits the dataset grows to a very modest total of 10. Obviously, this is smaller than we would like as it will make reaching the threshold of statistical significance (p < 0.05) less likely. But it is still worthwhile given the potentially pivotal importance of the natal Sun in the NYSE horoscope. Any transits to the Sun or Moon are more likely to have an outsized impact, and given Saturn’s bearish reputation, our working hypothesis for this Saturn-Sun pairing would be for a bearish effect.
The price effects table below shows the closing prices on the DJIA across various intervals before and after Saturn transits 6 Pisces 20. Due to the relatively slow speed of Saturn, 5-day intervals were used starting at 40 days before the conjunction and ending at 40 days after the conjunction.
The summary statistics table below analyzes the price change across various intervals starting with the longest 80-day window (“-40d 40d”). There is a consistent negative bias in these results although none reach statistical significance. Nonetheless, a few came fairly close such as the 60-day window (“-30d 30d”) which printed a p-value of 0.207. (i.e. an 80% probability the result was not due to chance.). The average price change was -2.32%, with the negative bias confirmed by a median of -1.87%. The 30-day post-conjunction period is also negative with an average price change of -1.49%.
While the small sample size should temper our enthusiasm to extrapolate from these results, the net effect is somewhat negative and coincides with the current pullback. The cumulative trend chart displays how this alignment may be following its historic tendencies with the largest declines coming after the exact conjunction at 6 Pisces. Here again, we see the current red line is approaching the average and median lows thus providing further evidence for an imminent bounce or rebound of some kind.
I have added this Saturn transit to 6 Pisces 20 to the Current Alignment Calendar including its average weekly decline of -0.37% based on the 1.49% decline over 30 days. (“0d 30d”). It still doesn’t account for last week’s decline since the Net Effect was still 0.01% and hence “Neutral”. But it is at least closer to what actually transpired in the markets last week.
Implications for this week
Saturn’s transiting sextile to the NYSE Sun is now separating and has moved out of its most effective range. Therefore, its negative weekly impact of -0.37% may now have largely played out. This is another reason why a rebound becomes more likely this week. The Net Effect in the Current Alignment Calendar is just 0.35% — a bullish bias but not overwhelmingly so. So far, the supposed bullish effects of the Saturn-60-Pluto alignment have been completely absent. Given how oversold the market is — the McClellan Oscillator is now nearing its April 2025 low — this week would be a reasonable time for the bullish influence of this alignment to finally show up. We’ll see.
The complicating factor here is that the Mercury-Mars-North Node alignment is still very close to exact. And with Mercury stationing direct on Friday, March 20 while in a one-degree conjunction with the North Node/Rahu, there remains significant room for doubt about any prospective rebound. When in close alignment with another planet as is the case here, Mercury direct stations suggest a reversal of trend. Since the trend has been down lately, this could also signal a rebound. So while the alignment statistics argue for a bounce this week, the transit charts still look pretty ugly. But then again, the charts should look ugly near an interim bottom. We will find out this week whether this will begin a reversal higher.
A separate question concerns the market direction in April. Saturn-60-Pluto alignment is exact March 28 and could coincide with some upside around that time. However, its post-alignment period is somewhat bearish and suggests that April could be negative. The Mars-Saturn conjunction and its alignments with Mercury and the North Node on April 19 may end up casting the deciding vote. I will take a look at the market effects of past Mars-Saturn conjunctions in my next post.
Disclaimer: Not intended as investment advice. For educational purposes only.
