

 (19 October 2025) Stocks rebounded last week after President Trump walked back his latest tariff threat against China. Gold and silver also extended their parabolic rallies, although bitcoin fell sharply for the second week in a row. The gains came despite the approaching Mercury-Mars conjunction (exact Oct 20) which evidence suggests had a modest bearish bias.
The partial recovery raises the possibility that the rally can now continue as investors prepare for further interest rate cuts from the Federal Reserve. However, narrowing market breadth is still a concern as the number of declining stocks have outnumbered the number of advancing stocks since mid-September. Moreover, the percentage of stocks above their 50-day moving average peaked in July and has made a series of lower highs ever since.
From our perspective, the planetary weather is uncertain. Markets sold off sharply on the Oct 10 Venus-Saturn opposition and remain somewhat vulnerable as long as Venus is transiting sidereal Virgo. Evidence suggests that the point of maximum bearishness in this transit occurs 16 days after Venus enters Virgo. Given the Oct 8 ingress into Virgo, that would make Oct 24 the theoretical point of maximum bearishness.
But we should be careful not to over-interpret from very limited data. While our study of Venus in sidereal Virgo did show a bearish bias, none of the results reached statistical significance as our sample size was quite small (n=35). A more balanced view is that the Venus-in-Virgo effect should be seen as a headwind — an influence that may undermine or impede the market but may not always be strong enough to generate losses.
The Mercury-Mars conjunction is another potential obstacle for the bull market. Even if there was little sign of its bearishness last week, it has yet to leave its effective time window. My research suggested that the first Mercury-Mars conjunction in the series tends to be the most bearish. The evidence suggests its effects manifest most strongly from 3 days before the conjunction until 3 days after. With the exact conjunction due on Oct 20, this equates to an effective window from Oct 17 to Oct 23.
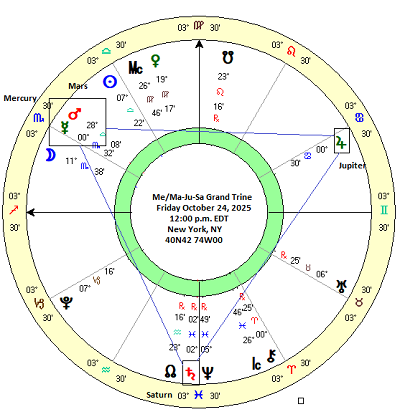
Taken together, these two influences keep open the possibility of further volatility this week. The Mercury-Mars conjunction in particular would seem to be more troublesome given its alignment with the North Lunar Node (aka Rahu). But it is unclear what will happen when the ongoing Mercury-Mars conjunction moves into alignment with Jupiter and Saturn at the end of this week. These four planets will form a rare double Grand Trine i.e. an equilateral triangle in which three or more planets are each separated by 120 degrees. Astrologers generally think of Grand Trines as powerful, auspicious alignments which, by extension, should translate into a bullish influence for financial markets. But what does the historical evidence say? Let’s dive in and see what the data shows.
Two triangles: the Mercury/Mars-Jupiter-Saturn alignment
Grand Trine alignments are rare enough, but this time there will be a double Grand Trine as both Mercury and then Mars will complete the triangle with the ongoing 120 degree alignment with Jupiter and Saturn. Slow-moving Jupiter and Saturn are currently in a tightening trine aspect which will be closest on November 17. The faster-moving Mercury and Mars will from the third point in the triangle starting from Tuesday, October 21 until about Sunday, November 2.
We should first note that the start and stop dates of this triangular alignment is a matter of judgment as there is no fixed date where each planet is exactly 120 degrees from the other. For the purposes of this study, I used a 5 degree orb for Mercury and a 3 degree orb for the slower-moving Mars. The Mercury-Jupiter-Saturn alignment is closest on Oct 24-25 although it is within range from Oct 21 until Oct 27. The Mars-Jupiter-Saturn alignment is closest on Oct 28-29 and is in effective range from say, Oct 24 until Nov 2.
Method
Using the Solar Fire calculation program, we see that there has only been 7 previous instances of a Mercury-Jupiter-Saturn Grand Trine since 1896, which is the inception date of the Dow Jones Industrial Average. Needless to say, this tiny sample size greatly diminishes our ability to determine probabilities for any outcomes from the current alignment. If this Mercury Grand Trine is rare, then the Mars-Jupiter-Saturn Grand Trine is even rarer, with only 4 previous cases. And if that wasn’t enough of methodological challenge, there have been exactly zero previous double Grand Trines of Mercury/Mars with Jupiter and Saturn since 1896. One previous instance in 1927 came close with the two Grand Trines occurring just three weeks apart but they were not simultaneous as is the case here. The table below show the dates and closing prices on the DJIA at various intervals before and after the Mercury alignment entry date.
Results 1: Mercury-Jupiter-Saturn
Let’s examine these two alignments separately. First, the Mercury-centered alignment. The summary statistics table below shows the price changes at various intervals for the Mercury-Jupiter-Saturn alignment. The left hand column is the longest interval of 60 days starting 30 days before the alignment until 30 days after (“-30d 30d”). The average gain was 4.91% which is much larger than the expected gain of 0.82% based on a 5% average annual return for the DJIA from 1906 to 2007. This result was not significant, however, although it came close (note the asterisk) at p=0.058. Nonetheless, this means that there is a 94.2% chance that this result was not the result of chance. Still, with n=7 it is difficult to make too much of this bullish Grand Trine effect.
Looking at the other intervals we can see that there was one statistically significant result for the 30-day window (“-15d 15d”) and another near-significant result for the “0d 30d” interval. These results are more evidence that this alignment may be bullish. Digging a bit deeper, we notice that the periods after the close alignment at “0d” (0 days) are more positive than the periods prior to the alignment. This is seen most clearly in the 30 days before the alignment (“-30d 0d”) which had an average gain of 1.16% and the 30 days after the alignment (“0d 30d”) at 3.72%.
This stronger bullish influence post-alignment is easily seen in the cumulative trend chart below. This chart tracks price changes starting from 30 days prior to the alignment and follows them until 30 days after. In terms of the current alignment, this translates to about Sep 24 for the first data point at -30d. The chart shows some negative price action in the run-up to the alignment but quickly moves above the expected line before the “0d” closest alignment mark. Both the average and median lines are only slightly above the expected result until 0d. The strong bullish effects are more manifest in the days following the closest alignment as lines move sharply higher. This looks very bullish indeed.
Results 2: Mars-Jupiter-Saturn
The table below shows the closing prices before and after the 4 previous Grand Trine alignments. Due to Mars’ slower speed, these alignments remain within effective range a bit longer as indicated by the often double-digit leaving dates (“L10d” for the current alignment which is 10 days). This means that Mars takes longer to leave the alignment with Jupiter and Saturn. Whether this is bullish or bearish is more difficult to say, however, as the summary statistics table below shows.
The averages and medians adhere more closely to the expected values, although there is a lot of variation through various intervals. Unlike the Mercury-centered alignment, none of these Mars-centered alignments were statistically significant. Overall, it seems that this particular Grand Trine is less bullish than the Mercury Grand Trine.
This less impressive result is seen in the cumulative trend chart below. Yes, the average and median lines are above the expected line indicating a bullish bias. But the variation is large and the extent of the deviation from the expected line is fairly small. There seems to be a bullish spike 9 days (“9d”) after the alignment entry date but it is fleeting as the lines fall back to the long term average of the expected line. With only 4 cases, it is more difficult to make any inferences from this sample. The Mars data are less consistent than the Mercury sample and are thus less reliable.
Conclusion
Perhaps all we can conclude from these two tiny samples is that the Grand Trine alignments have a modest bullish bias. In addition, this bias appears to be stronger in the days following the closest alignment. Given this positive influence, there may be less support for the popular bearish view that the market is on the verge of a much larger sell-off. As far as these alignments are concerned, there is no evidence that they are bearish. It doesn’t mean stocks can’t decline in the days or weeks ahead, only that these alignments don’t provide any support for that view. The wild card here is that there is no precedent for a double Grand Trine.involving Mercury, Mars, Jupiter and Saturn. Will the strongly bullish effects of Mercury have an additive effect with the mildly bullish effect of Mars to produce a much stronger rally? Or could these combined energies somehow shift their period of manifestation? We simply don’t know.
Implications for this week
Since these triangular alignments only coincide with very mildly bullish moves in the days prior to their closest approach, we should keep an open mind about markets this week. Any positive effects from these alignments are more likely to appear next week (Oct 27-31) rather than this week. Additional downside fallout is still very possible from the Mercury-Mars conjunction this week, especially given the trine aspect from the North Lunar Node (Rahu). Given the proximity of the aspect, the first half of the week may be more vulnerable.
Looking further ahead, we may also note the approach of the Jupiter-Saturn trine aspect. Although this will not form an exact 120 degree alignment, it will come to within 9 arc minutes of exact on November 17. On the face of it, this combination is often seen as bullish as the expansive optimism of Jupiter supposedly blends in a constructive way with Saturn’s more measured and disciplined energy. But its consequence for markets is unclear as this aspect is associated with some major down moves in 1987 and 2008.
While the aspect was not immediately implicated in the largest declines in those historic sell-offs, it was present in the background. For example, stocks formed interim lows on January 21, 2008 and November 20, 2008 — both dates when Jupiter was exactly 120 degrees from Saturn. Obviously, many other exact Jupiter-Saturn aspects were not closely correlated with interim lows and indeed some coincided with strong rallies. It suggests that Jupiter-Saturn aspects can bring about divergent outcomes which depend on other factors
I will post more analysis of the market effects of the Jupiter-Saturn trine aspect next week.
If you would like to receive my posts as an email, please subscribe to my free Empirical Astrology newsletter.
Disclaimer: Not intended as investment advice. For educational purposes only.
