

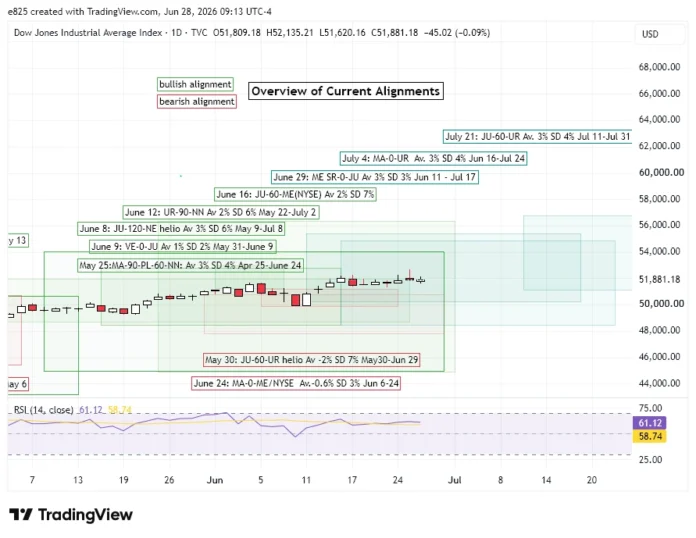
 (28 June 2026) Stocks were generally lower last week as investors took profits in overheated technology and AI-related sectors. While the NASDAQ and S&P 500 were negative on the week, the rest of the market was actually higher as the Dow (DJIA), small cap Russell 2000 and NYSE Composite finished higher on prospects of lower oil prices and moderating inflation.
The tech pullback coincided with a period of relative weakness given the conjunction of Mars to Mercury in the NYSE chart. Based on our backtest of previous conjunctions, stocks tended to be modestly negative in the 12 or 18 days leading up to the June 24 conjunction. The updated cumulative chart below illustrates this period of relative weakness, even if the price changes for the current conjunction (red line) has actually been quite bullish. One reason for this discrepancy is that we used the DJIA for the backtest. Since the Dow has relatively little tech exposure in its 30 constituent companies, it has not been subject to the current ‘June swoon’. In fact, it actually made a new all-time high last week.
Other current alignments remain mostly bullish. The 90-degree square alignment of Uranus and the North Lunar Node on June 12 continues to track higher, although here also we used the more bullish DJIA for price data. The updated cumulative trend chart below shows the current up trend exceeds the mean and median lines of previous alignments. Nonetheless, the recent gains of this post-alignment period is largely in keeping with the bullish bias of this pairing.
The upcoming conjunction of Mars and Uranus on July 4 has so far underperformed its historical backtest. An analysis of its previous conjunctions showed a clear bullish bias through the pre- and post-alignment periods. Its relative weakness may be attributed to its random backtest starting point in the middle of the current consolidation/pullback 18 days before the July 4 conjunction. A longer look back period might well have generated a line that tracked the mean and median lines more closely.
The upcoming Mercury retrograde station on Monday, June 29 is another bullish factor that could support stocks in the coming week. As we noted in our backtest study, the fact that Mercury is turning retrograde while in a 3.5 degree conjunction with Jupiter is actually bullish. The updated cumulative trend chart below shows how the current trajectory of the DJIA is following the historical norms for this unique alignment. Far from being bearish as is commonly assumed, the data indicates that retrograde Mercury tends to be bullish when it is conjunct Jupiter both before and after the retrograde station…
To read the rest of this post, please visit my Empirical Astrology Substack.
