

 (4 March 2026) US stocks are down are so far this week as investors weigh the geopolitical fallout of the US-Israeli attack on Iran. The indexes fell sharply at the open on Tuesday but staged a substantial recovery by the close of trading although they still finished lower on the day.
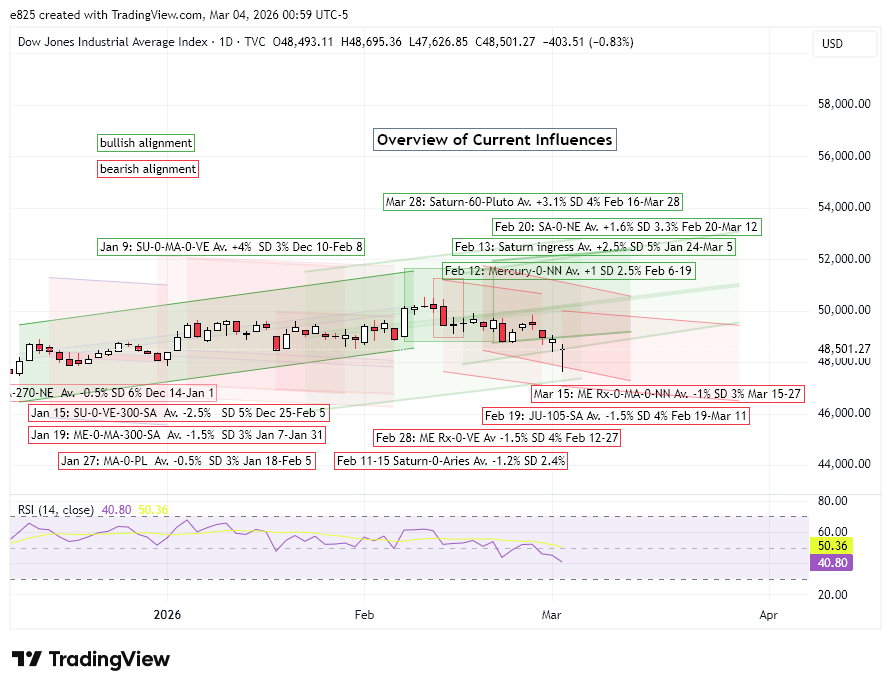
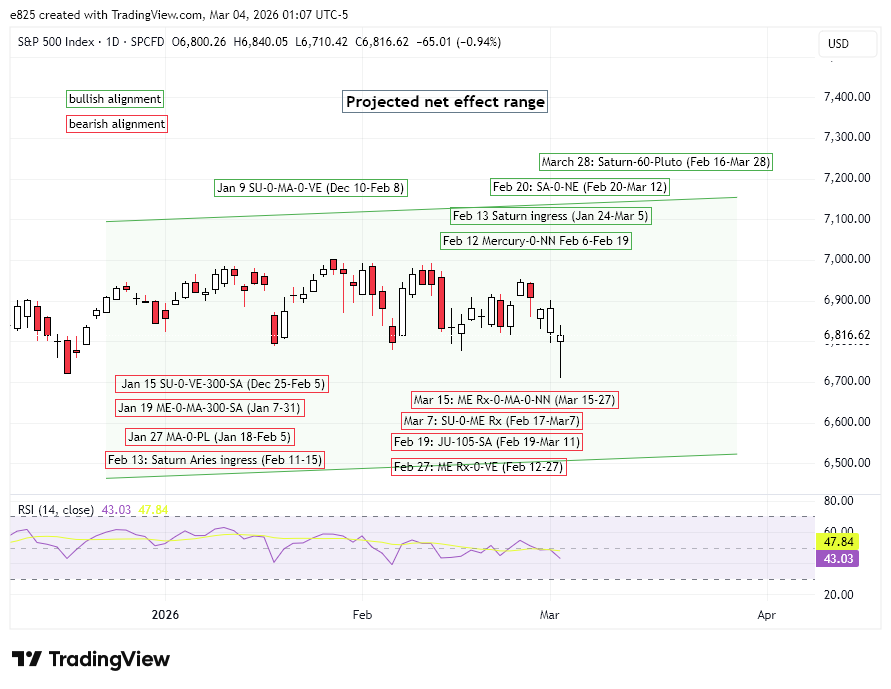
This bearish start to the week isn’t too surprising given the negative track record of the current alignments. The Jupiter-105-Saturn alignment that was exact on Feb 19 has seemingly played a role with this market decline. The current alignment (red line) started off well above the average and median but is now undergoing some mean reversion. Given the divergence between the average and median, however, this can no longer be considered a strong bearish influence. Further downside is possible (see the light blue average line) but upturn in the median line suggests a more neutral bias.
Similarly, the Feb 27 conjunction of Mercury retrograde and Venus is finally manifesting its bearish influence as indicated by the average and median lines. Here again, the long term average of this alignment suggests stocks may be at or approaching their interim low. Of course, the usual caveats apply that this is only one alignment out of many and that backtest of past alignments does not predict the effects of future alignments. But since the average and medians formed lows 3 days after the conjunction (“3d”) and March 3 was 3 days after the current alignment, this conjunction is now shifting from slightly bearish to slightly bullish in its influence. So if these bearish alignments are weakening, does this mean markets will rebound soon? The ongoing Mercury retrograde period means there is no simple answer to that question.
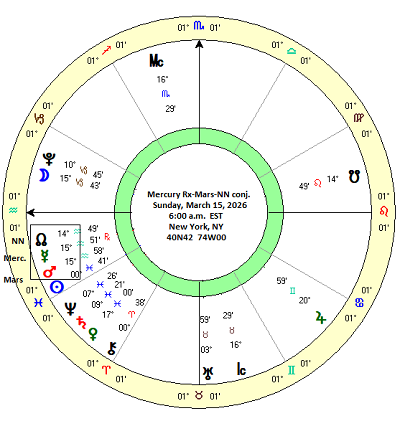
March 15: Mercury retrograde conjoins Mars and the North Lunar Node
In Sunday’s post, I discussed the possible bearish effects of the conjunction of Mercury retrograde and the Sun on March 7. Our backtest showed very little negative effect from this conjunction despite a decent-sized sample (n=51). While the 18-day window leading up to the conjunction (i.e. Feb 17-Mar 7 for the current conjunction) almost reached statistical significance (p = 0.079), the effect size was tiny — just -0.24%. Nonetheless, it does provide further evidence that Mercury retrograde is a bearish influence, especially when it aligns with other planets.
In this midweek update, I want to take a brief look at the next conjunctions involving Mercury retrograde (“Rx”), namely Mars and the North Lunar Node on March 15. On that date, Mercury will form a rare triple conjunction with Mars and the North Lunar Node (aka Rahu in Vedic astrology) within just one degree. This has only occurred 18 times since 1896 and that includes conjunctions for when Mercury was direct and retrograde. The triple conjunction with retrograde Mercury has occurred only 5 times. Only conjunctions with less than a 5 degree orb were included in the sample.
On the face of it, this should be a bearish influence since Mars is a malefic and the North Node tends to be malefic, especially in Vedic astrology. And if Mercury becomes malefic when it is retrograde, then we should see some obvious negative price effects.
The table below shows the DJIA closing prices for the 18 previous cases at various intervals from 1898 to 2026. The first column shows prices 21 days before the conjunction, the second column lists prices 18 days before the conjunction and so on, every 3 days until the last column which gives the prices 21 days after the conjunction.
The summary statistics table below analyzes the price changes for different intervals. The first column lists the longest interval of 42 days while the second column shows price changes for the first half of that interval, i..e in the 21 days leading up to the conjunction. While none of the intervals reached statistical significance, a number of them were clearly bearish. Moreover, we can see a pattern whereby the period after the conjunction tends to be more bearish than the period before. And yet without statistical significance, we should be cautious about drawing too many conclusions.
The cumulative trend chart below reflects this overall bearish bias and an unexpected bullish phase too. The average and median lines both show a double dip before and after the conjunction. However, the period immediately before and after the conjunction (3-6 days) is actually a bit bullish. We can see the current alignment (red line) is tracking these average and median lines fairly closely. If the trend continues, further downside this week is possible. However, as we get closer to the March 15 conjunction date, there is an increased likelihood of some upside, at least temporarily. With both average and median lines falling after the conjunction, it is possible that we could see stocks make another move lower after March 15.
Implications for this week
The effect of this Mercury-Mars-North Node would appear to increase the chances of more selling this week. Even though the bearish influence of Jupiter-105-Saturn and Mercury Rx-0-Venus is likely waning, this triple conjunction could still keep volatility elevated.
I would also note that Wednesday’s alignment of the Moon, Mars, Saturn and Neptune looks very bearish, especially near the 4:00 p.m. EST close. If there is a sharp drop on Wednesday, that might set the stage for a late week bounce as hinted at by the Sun-Mercury Rx-Jupiter alignment. And if the current alignment follows the established pattern, further gains become somewhat more likely next week (March 9-13).
Disclaimer: Not intended as investment advice. For educational purposes only.
If you would like to receive this posts as an email, you can subscribe to my free Substack newsletter, Empirical Astrology.
