 (21 November 2021) US markets continued their ascent last week as technology stocks benefited from falling bond yields after a surge in Covid infections in Europe brought new restrictions. Stocks have been in rally mode since October as earnings have generally been strong and the Fed remains wedded to its ultra-loose monetary policy despite sharply rising inflation. The rally is increasingly narrow, however, as most of the gains have been confined to the big tech companies while the rest of the market lags.
How long can this rally last? The life of the bull market may ultimately depend on a rapid end to the current inflation spike since this entire asset bubble (stocks, real estate, bitcoin) is contingent upon the Fed’s near-zero rate policy. In the near term, it is tempting to think that stocks will continue to rise into the New Year since December tends to be among the more bullish months of the year as evidenced by the phenomenon known as the Santa Claus rally.
But the upcoming planetary alignments do not offer clear support for this bullish view. In fact, the month of December could well diverge from the typical year-end bullishness as Venus is due to turn retrograde on Dec 19. As the planet that symbolizes value, Venus retrograde cycles have a negative correlation with stock prices as its backward apparent motion reverses its usual positive influence. I hope to explore this correlation in more detail in future posts.

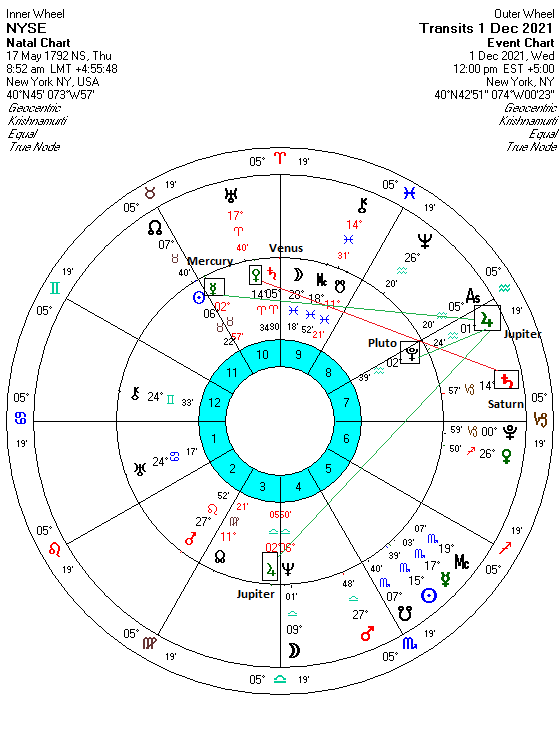
Another window on the near term trends is seen through the horoscope of the New York Stock Exchange (May 17, 1792). I should note that there is no consensus among financial astrologers on the correct time for this chart. I have generally used the 10.10 a.m. chart while trying to avoid making any strong predictions that derive solely from the exact time, i.e. the Ascendant, Midheaven, or the Moon and its resulting minor dasha periods. Here I’m using the 8.52 a.m. chart although again I am avoiding making any deductions from the more time-sensitive elements in the chart.
Regardless of the exact time one uses for the chart, we can see that the current transit of Jupiter is one reason why stocks have been moving higher. Jupiter just entered sidereal Aquarius two days ago and will move to 1 degree of Aquarius on December 1, the date I have chosen to cast the chart for. We can see that it is very close to an exact conjunction with Pluto (2 Aquarius) as well as lesser alignments with natal Jupiter (2 Libra) and Mercury (2 Taurus). Since all three alignments are bullish influences, it is more likely that the trend will stay fairly positive at least until Jupiter makes its exact conjunction with Pluto at 2 degrees of Aquarius in early December.
Of course, market sentiment cannot be reduced to the placement of a single planet. While Jupiter enjoys an outsized importance in determining market trends, the condition and placement of bearish Saturn is also more important than the transits of the faster-moving planets. Saturn (14 Capricorn) is currently in a 90-degree square alignment with natal Venus (14 Aries). As a rule, Saturn-Venus alignments tend to be bearish but there is little evidence that this pairing has had any effect on stocks. One explanation is that this is not a full-strength aspect according to traditional Vedic rules which stipulates that the full strength square only throws Saturn’s negative energy forward 9 houses/270 degrees, and not 3 houses/90 degrees. The 90 degrees square aspect is therefore has a significantly reduced bearish effect on Venus in the NYSE chart, even when in exact degreewise alignment. It is still theoretically bearish but it may require a second or third triggering planet to release Saturn’s bearish payload.
Therefore, we can see something of a mixed picture in the near term. Given its greater number of aspects, Jupiter’s bullish influence looks more active than Saturn’s potentially negative alignment. While the presence of the Saturn-Venus square means we cannot completely rule out some brief weakness or consolidation, the strong Jupiter influence here suggests that a deep pullback is unlikely over the next two weeks or so.
For more details,
Photo Credit: ajay_suresh
You can be notified of new posts if you follow ModernVedAstro on Twitter.
Please note that this is a more general and much abbreviated free version of my
investor newsletter which can be subscribed to here.
Please read my Disclaimer
Market forecast for week of 8 November 2021
Market forecast for week of 1 November 2021
Market forecast for week of 25 October 2021
Market forecast for week of 18 October 2021
Market forecast for week of 11 October 2021
Market forecast for week of 4 October 2021
Market forecast for week of 27 September 2021
Market forecast for week of 20 September 2021
Market forecast for week of 13 September 2021
Market forecast for week of 6 September 2021
Market forecast for week of 30 August 2021
Market forecast for week of 23 August 2021
Market forecast for week of 16 August 2021
Market forecast for week of 9 August 2021
Market forecast for week of 2 August 2021
Market forecast for week of 26 July 2021
Market forecast for week of 19 July 2021
Market forecast for week of 12 July 2021
Market forecast for week of 5 July 2021
Market forecast for week of 28 June 2021
Market forecast for week of 21 June 2021
Market forecast for week of 14 June 2021


