 (10 February 2021) As US stocks hit another all-time high today, one wonders if this 12-year old bull market will ever end. With the Federal Reserve doing somersaults to keep the bull party going, more observers are talking about the bull market as the default setting for the foreseeable future. Of course, from an historical perspective, stocks do tend to rise over time. But previously, bull markets were followed by bear markets as a reflection of the ebb and flow of the capitalist economic cycle.
But ever since the 2008 meltdown, the Fed has been keen to keep interest rates low and buy bonds and other debt instruments in order to push more investors into risky assets like stocks. The Fed’s stated goal is to generate a “wealth effect” by driving stocks higher so that enriched investors spend more freely and thereby boost the consumer-based economy.
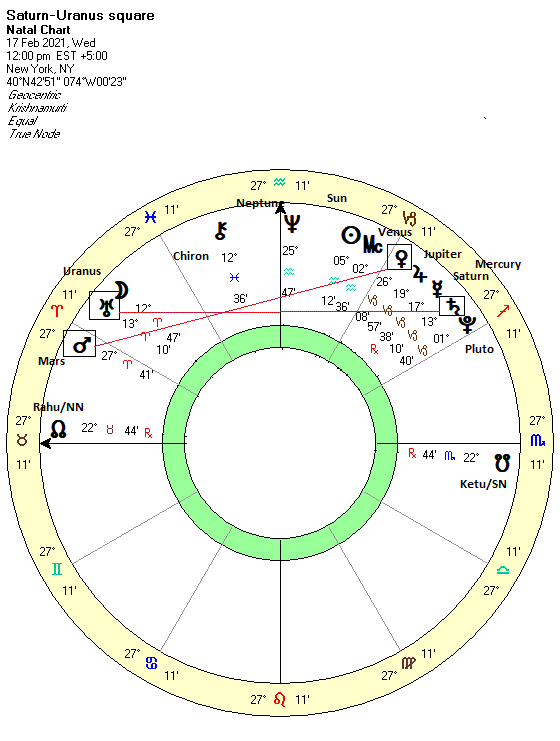
While we may question whether the Fed is wise to keep pushing markets higher, several planetary alignments this year suggests an end of the rally may at hand. One in particular is the approaching 90-degree square aspect of Saturn and Uranus next week on February 17. Saturn and Uranus do not blend their energies very easily as Saturn symbolizes tradition and structure while Uranus represents change and rebellion. Therefore Saturn-Uranus alignments, especially those in hard aspect (90 and 180 degrees), can be disruptive and signal breaks with the prevailing trend.

Both of these distant planets are slow-moving and thus their alignments occur very infrequently. The complete Saturn-Uranus synodic cycle is 45 years, with the more disruptive, hard aspects occurring every 11 or so years. The last hard aspect was an opposition that took place from late 2008 until mid-2010. The previous Saturn-Uranus square occurred in 1999-2000. Typically, these hard aspects are within range for an extended time due to the retrograde cycles of both planets. Thus, Saturn and Uranus may form three or four exact squares during a 1-2 year period.
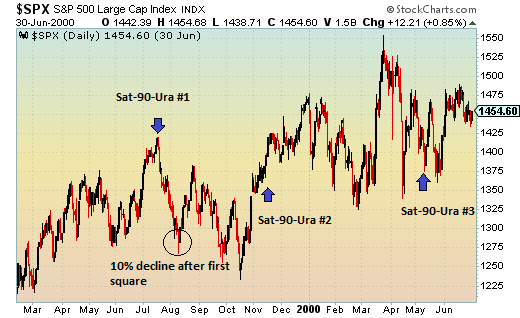
Students of stock market history will know that both of these previous Saturn-Uranus alignments had significant correlations with the market. The 1999-2000 square marked the end of the Reagan-Clinton bull market (1982-2000) and the start of the three-year bear market from 2000-2003. The 2008-2010 opposition aspect coincided with the end of the financial crisis and start of the current Fed-fueled bull market.
While there is a clearly bearish overtone in these Saturn-Uranus aspects, their exact aspects do not always correspond to falling markets. Instead, it seems better to think of the alignments as leading to changes in the prevailing trend. Even there, the effects may not be specifically associated with exact timed aspects but rather as underlying influences during the time that Saturn and Uranus are within range.
The Saturn-Uranus square 2021
Next week, Saturn will form a square aspect with Uranus on Wednesday, February 17. This will be the first of three exact square aspects in 2021, with the other alignments taking place on June 14 and December 23. Given that stocks have been in a bull market for 12 years, this year’s Saturn-Uranus square offers some evidence that change may be in the air. Volatility seems more likely to increase in the coming months during this protracted alignment, although it is possible some narrow sectors of the market could continue to rise in 2021, just as tech did in early 2000.

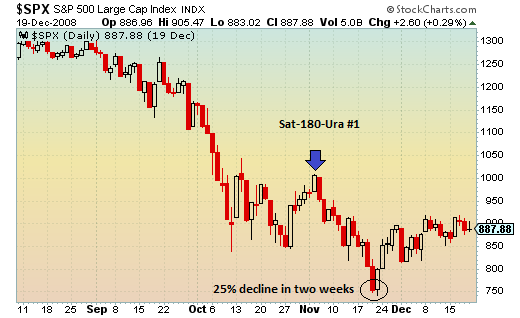
One thing we should note is that the first square aspect in the series may be more bearish than the other two. The price chart from 1999 actually shows an eerie coincidence of the interim high on the S&P 500 taking place on July 16, just two days before the exact Saturn-Uranus square. Stocks then fell 10% in the next four weeks. The correlation also occurs with the first Saturn-Uranus opposition (different angular separation but similar in symbolism) on November 4, 2008 on the same day stocks formed an interim high after October’s brutal sell-off and then fell another 25% until the November 20 low.

So there is some reason for investors to be extra cautious in the coming days. It is very possible we could see a repeat of the above scenarios since the Feb 17 square will be the potentially more bearish first alignment out of the three set for 2021. And I would think that the near simultaneous Venus-Mars square late next week would create an even stronger negative resonance between all four planets.
Given the disruptive energy of Saturn and Uranus pervading through much of 2021, there is some reason to think that time is finally running out for this long bull market.
For more details,
You can be notified of new posts if you follow ModernVedAstro on Twitter.
Please note that this is a more general and much abbreviated free version of my
investor newsletter which can be subscribed to here.
Please read my Disclaimer
Market forecast for week of 1 February 2021
Market forecast for week of 25 January 2021
Market forecast for week of 18 January 2021
Market forecast for week of 11 January 2020
Market forecast for week of 4 January 2021
Market forecast for week of 28 December 2020
Market forecast for week of 21 December 2020
Market forecast for week of 14 December 2020
Market forecast for week of 7 December 2020
Market forecast for week of 30 November 2020
Market forecast for week of 23 November 2020
Market forecast for week of 16 November 2020
Market forecast for week of 9 November 2020
Market forecast for week of 2 November 2020
Market forecast for week of 26 October 2020
Market forecast for week of 19 October 2020
Market forecast for week of 12 October 2020
Market forecast for week of 5 October 2020
Market forecast for week of 28 September 2020
Market forecast for week of 21 September 2020
Market forecast for week of 14 September 2020
Market forecast for week of 7 September 2020
Market forecast for week of 31 August 2020
Market forecast for week of 24 August 2020
Market forecast for week of 17 August 2020
Market forecast for week of 10 August 2020
Market forecast for week of 3 August 2020
Market forecast for week of 27 July 2020
Market forecast for week of 20 July 2020


